
Connecting the Dashboard
The Dashboard is the macOS control surface for EventSync. This section covers first connection, authentication, network configuration and the global client-app settings that apply to every device on your show.
First connection
The Dashboard auto-discovers EventSync Servers on the local network via Bonjour — if your server is running on the same subnet / VLAN, it should appear automatically under Server Connection. If it doesn't, use the Scan button, or enter connection details with Manual Connect.
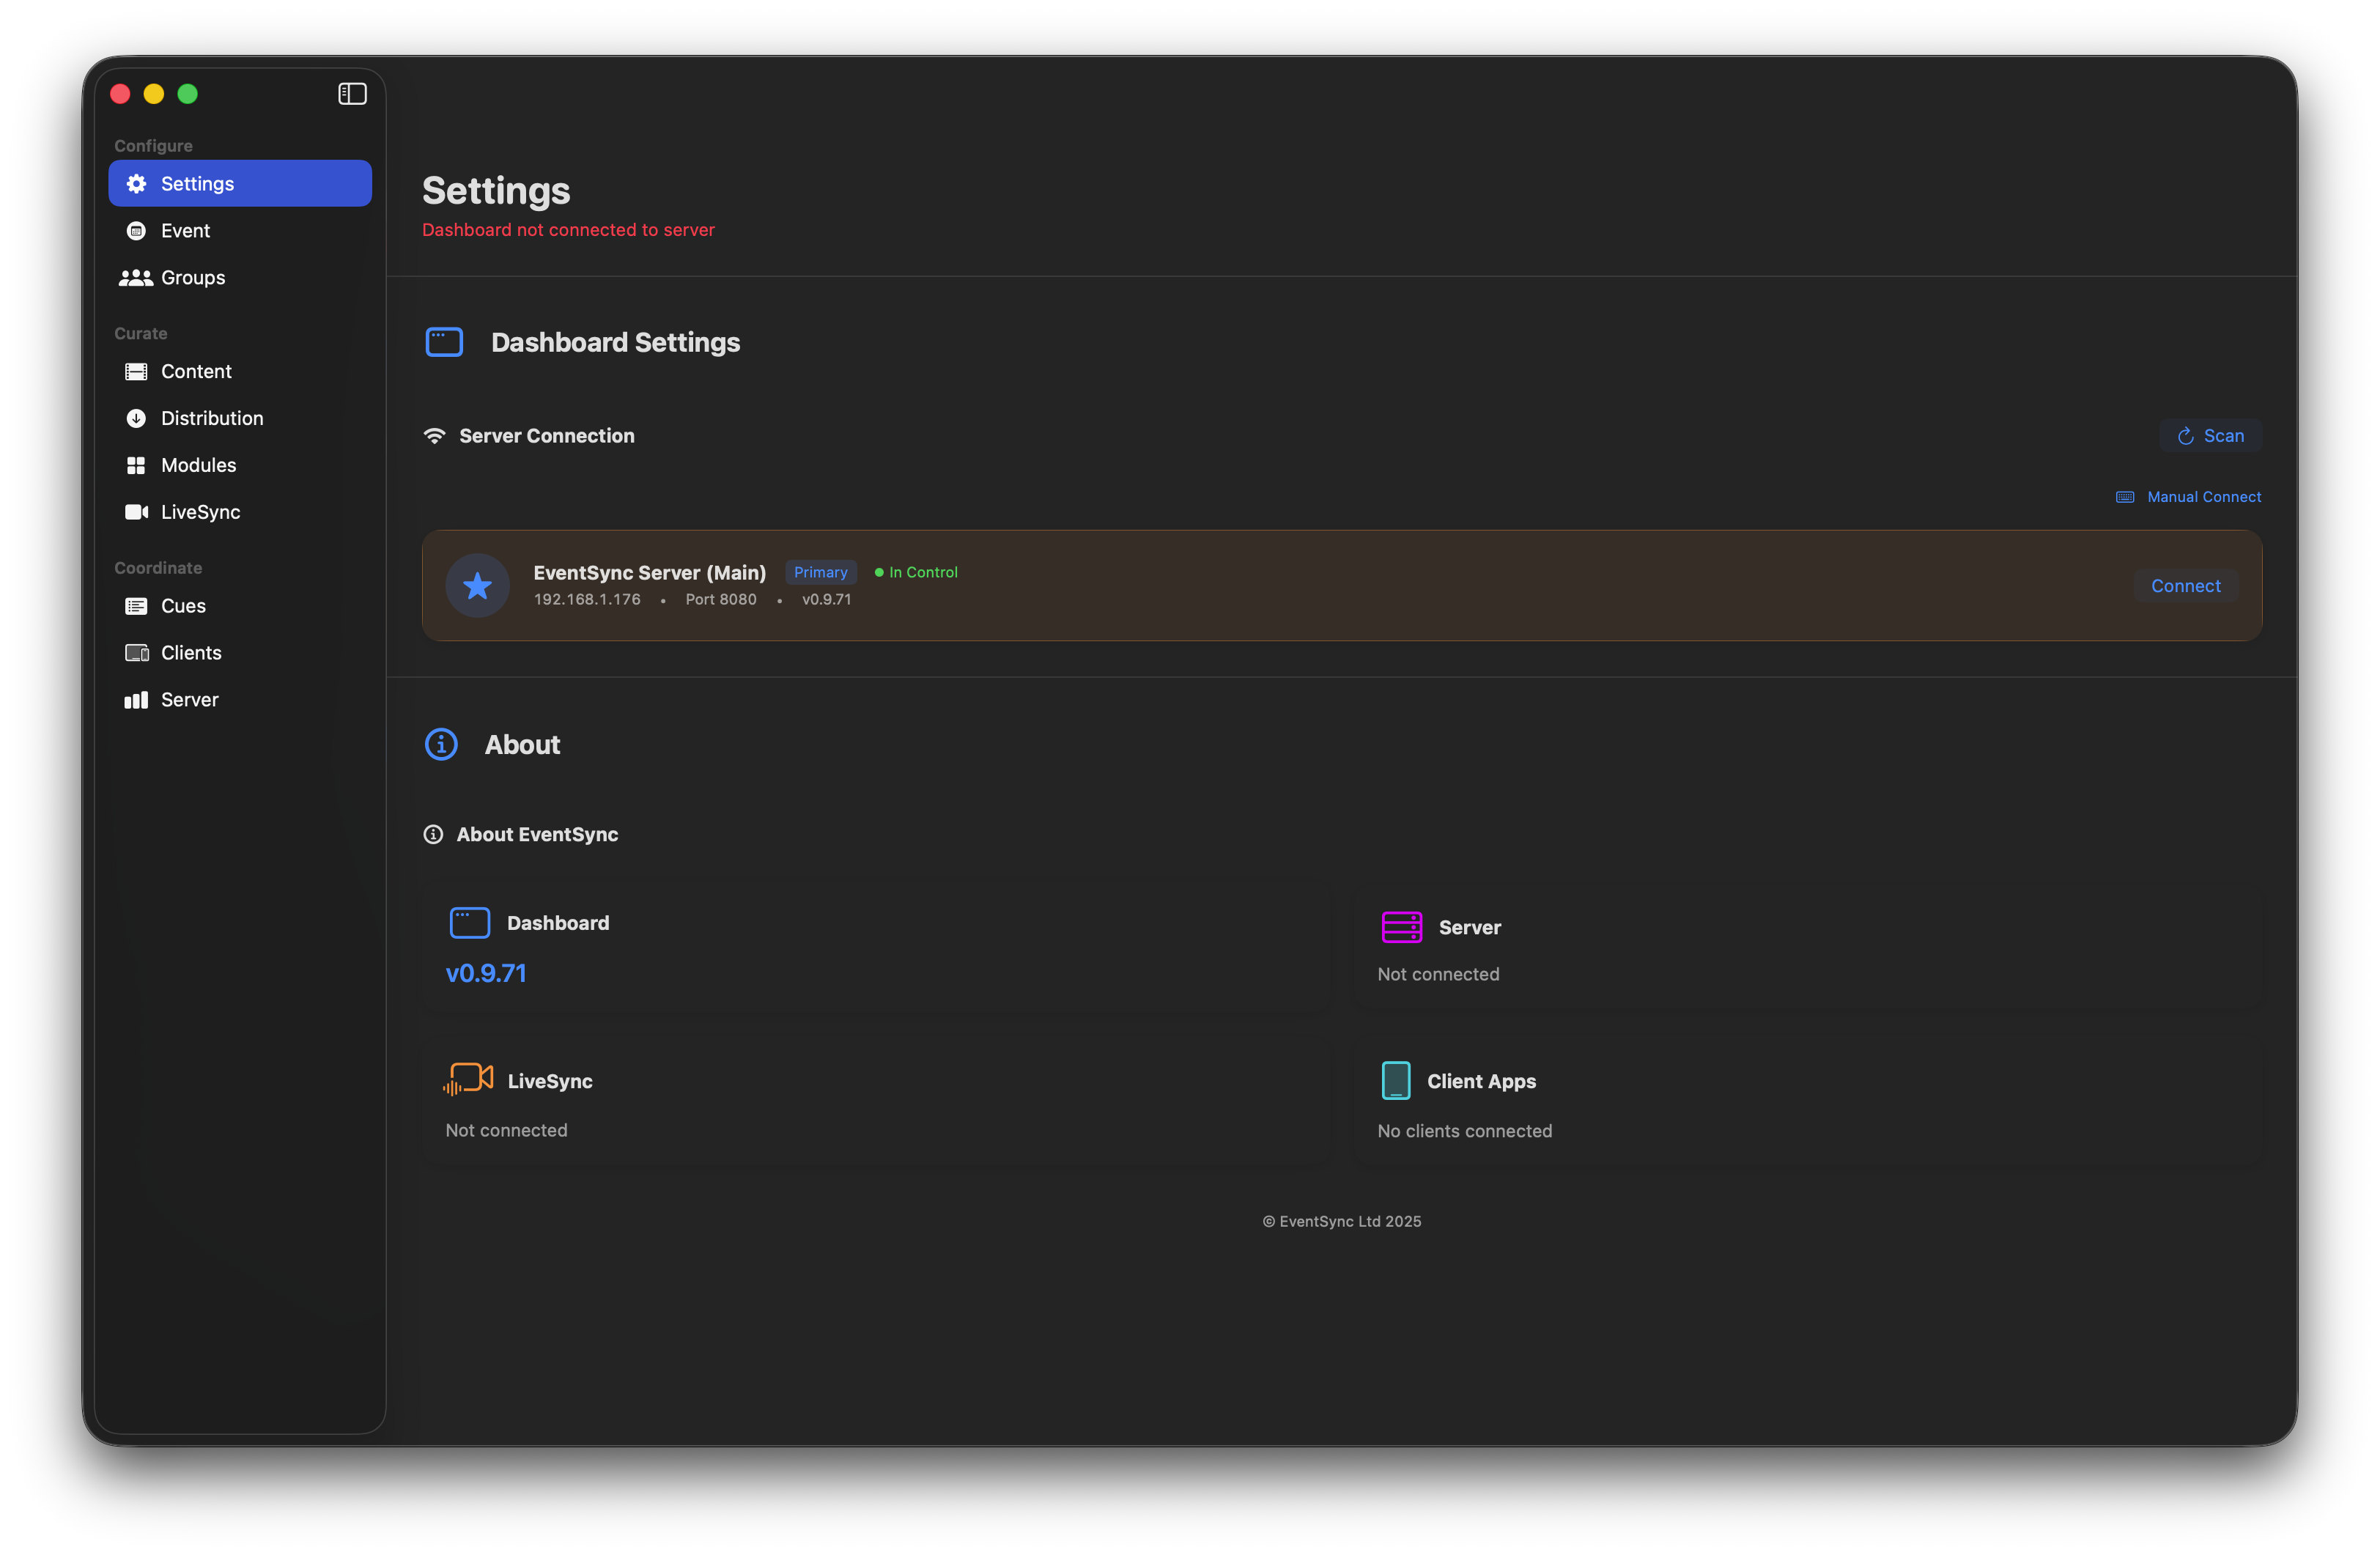
A fresh Dashboard with no server connection yet. The sidebar is dimmed until you connect.
The Dashboard deliberately doesn't auto-connect to a server on the same Mac, because that's not the only valid setup — you might run servers on one Mac and operate from another, you might have multiple operators each running their own Dashboard, or you might swap a single Dashboard between the Primary and Backup during a show. Once you've connected, the Dashboard remembers the server and its PIN and reconnects automatically on relaunch. It only stops reconnecting when you click Disconnect.
PIN authentication
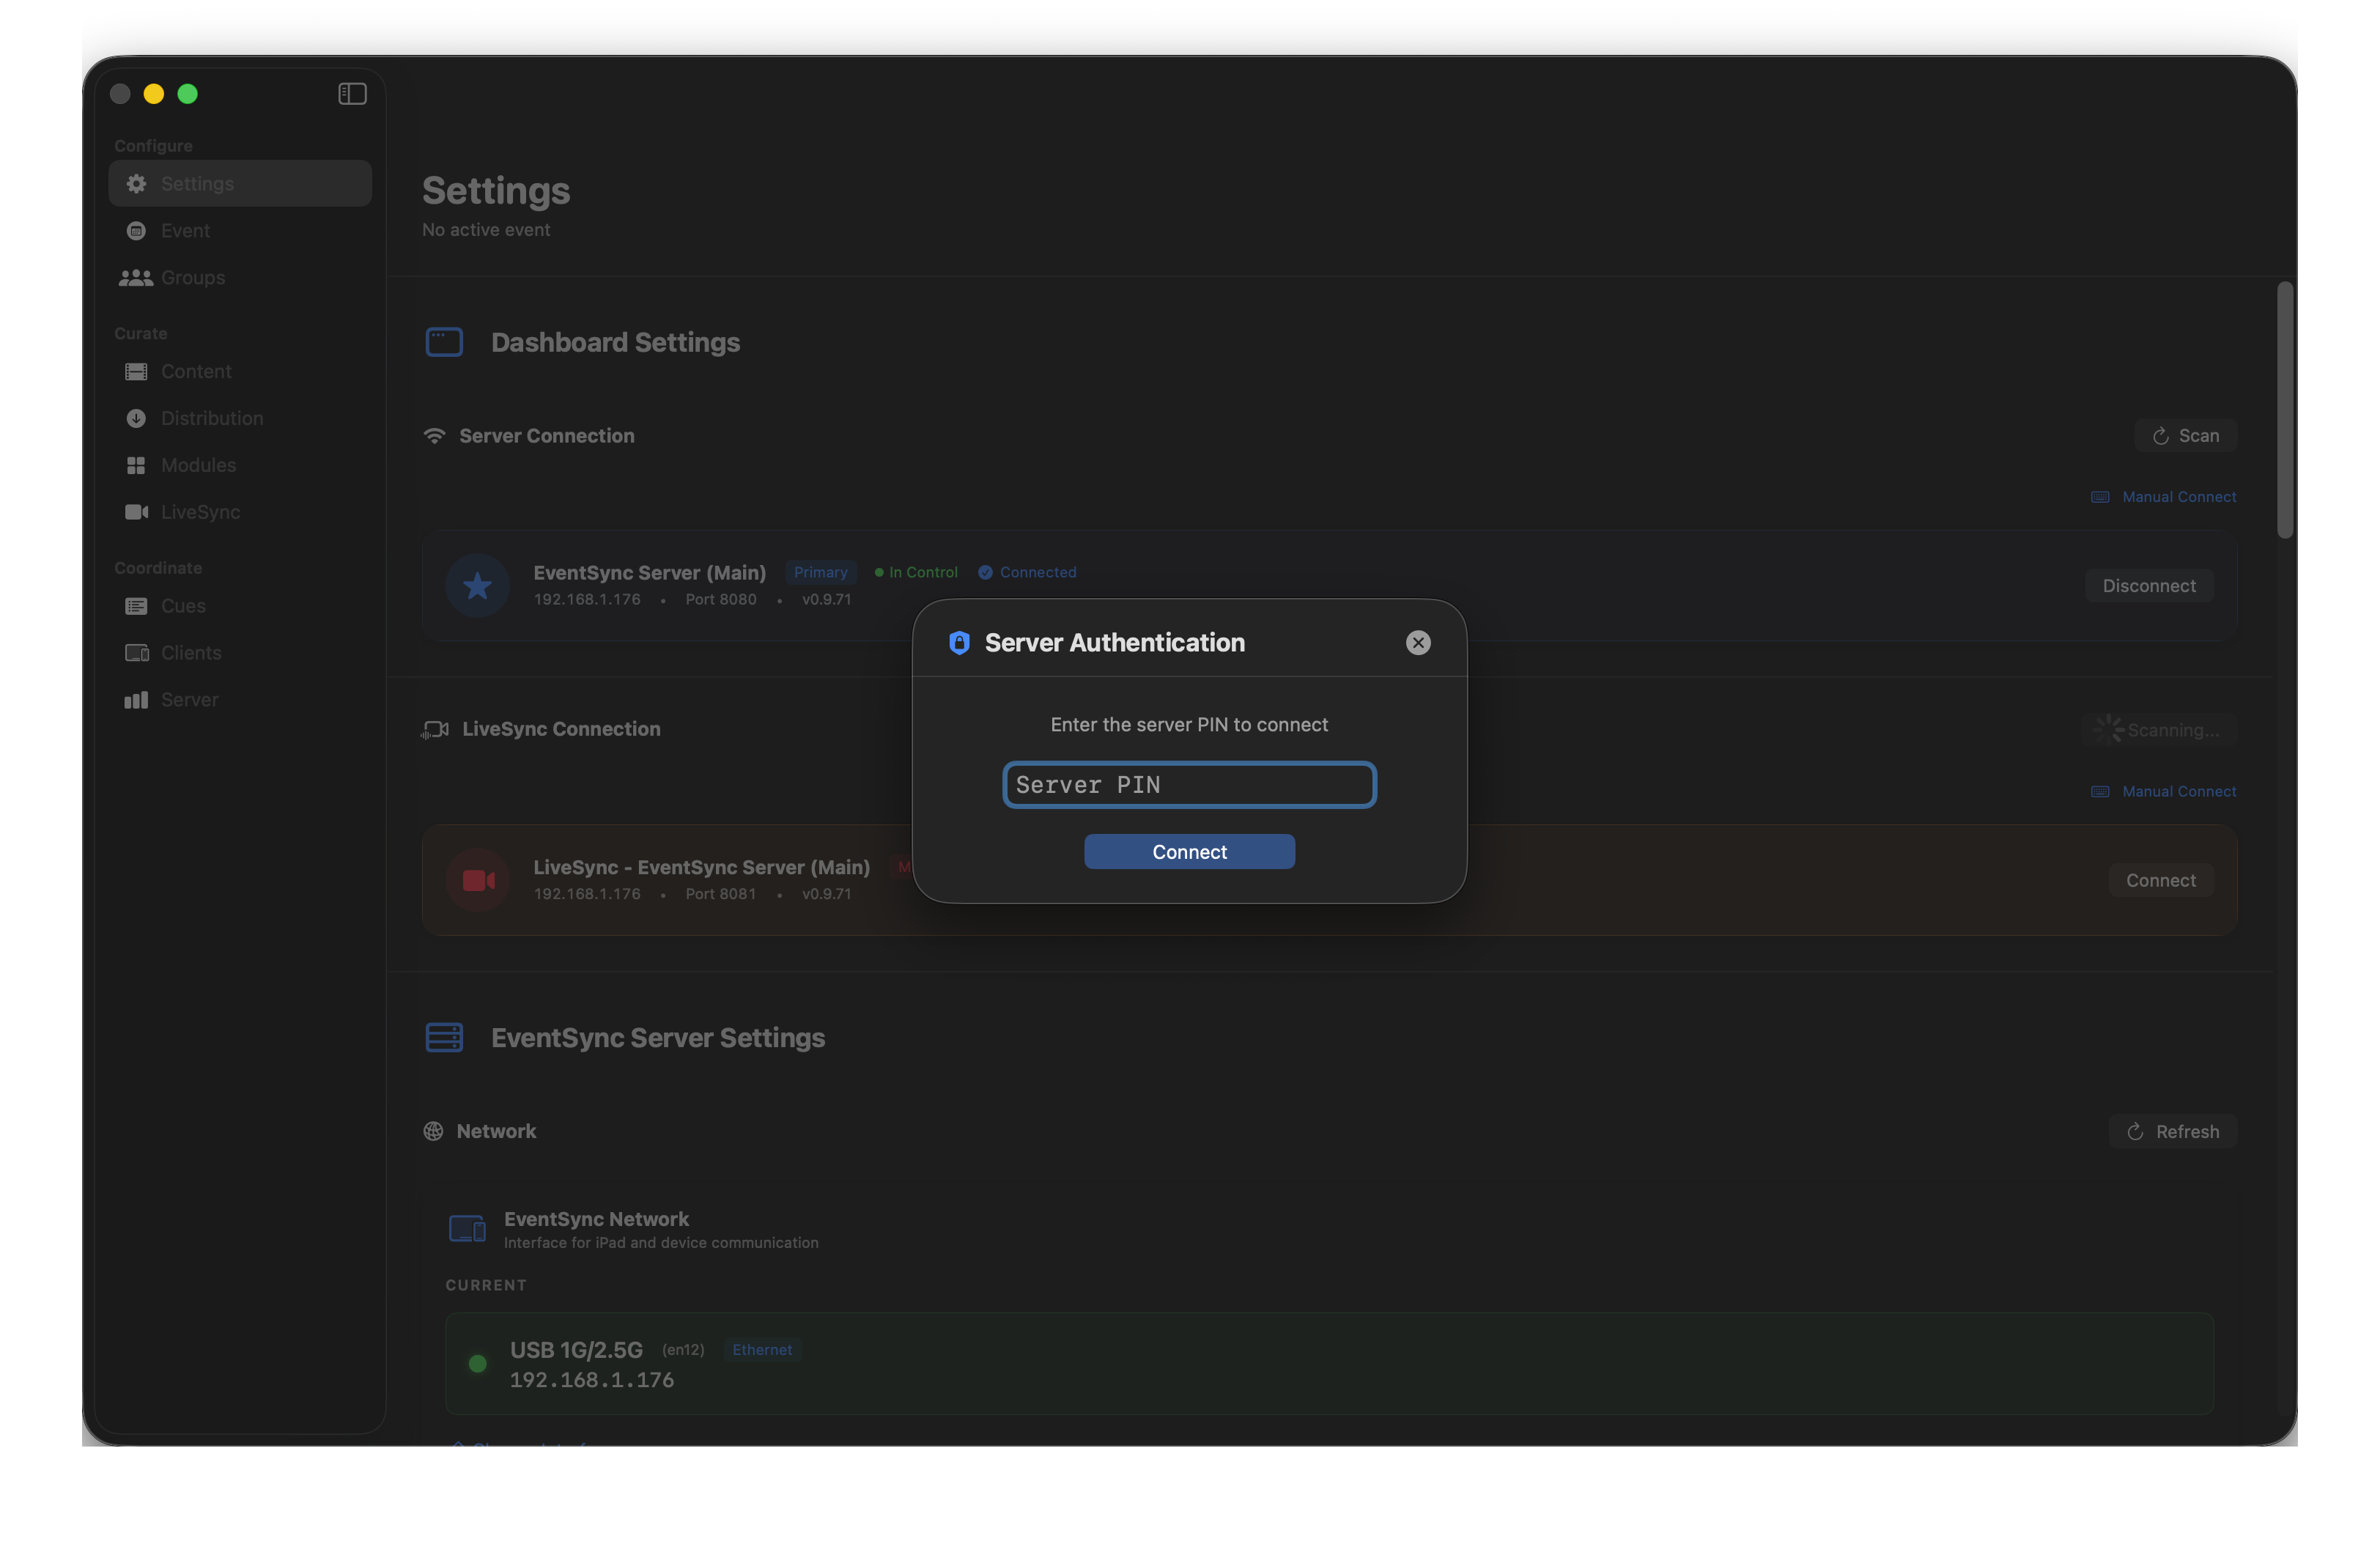
When you click Connect, the Dashboard asks for the server PIN you set on the server (Setting a server PIN).
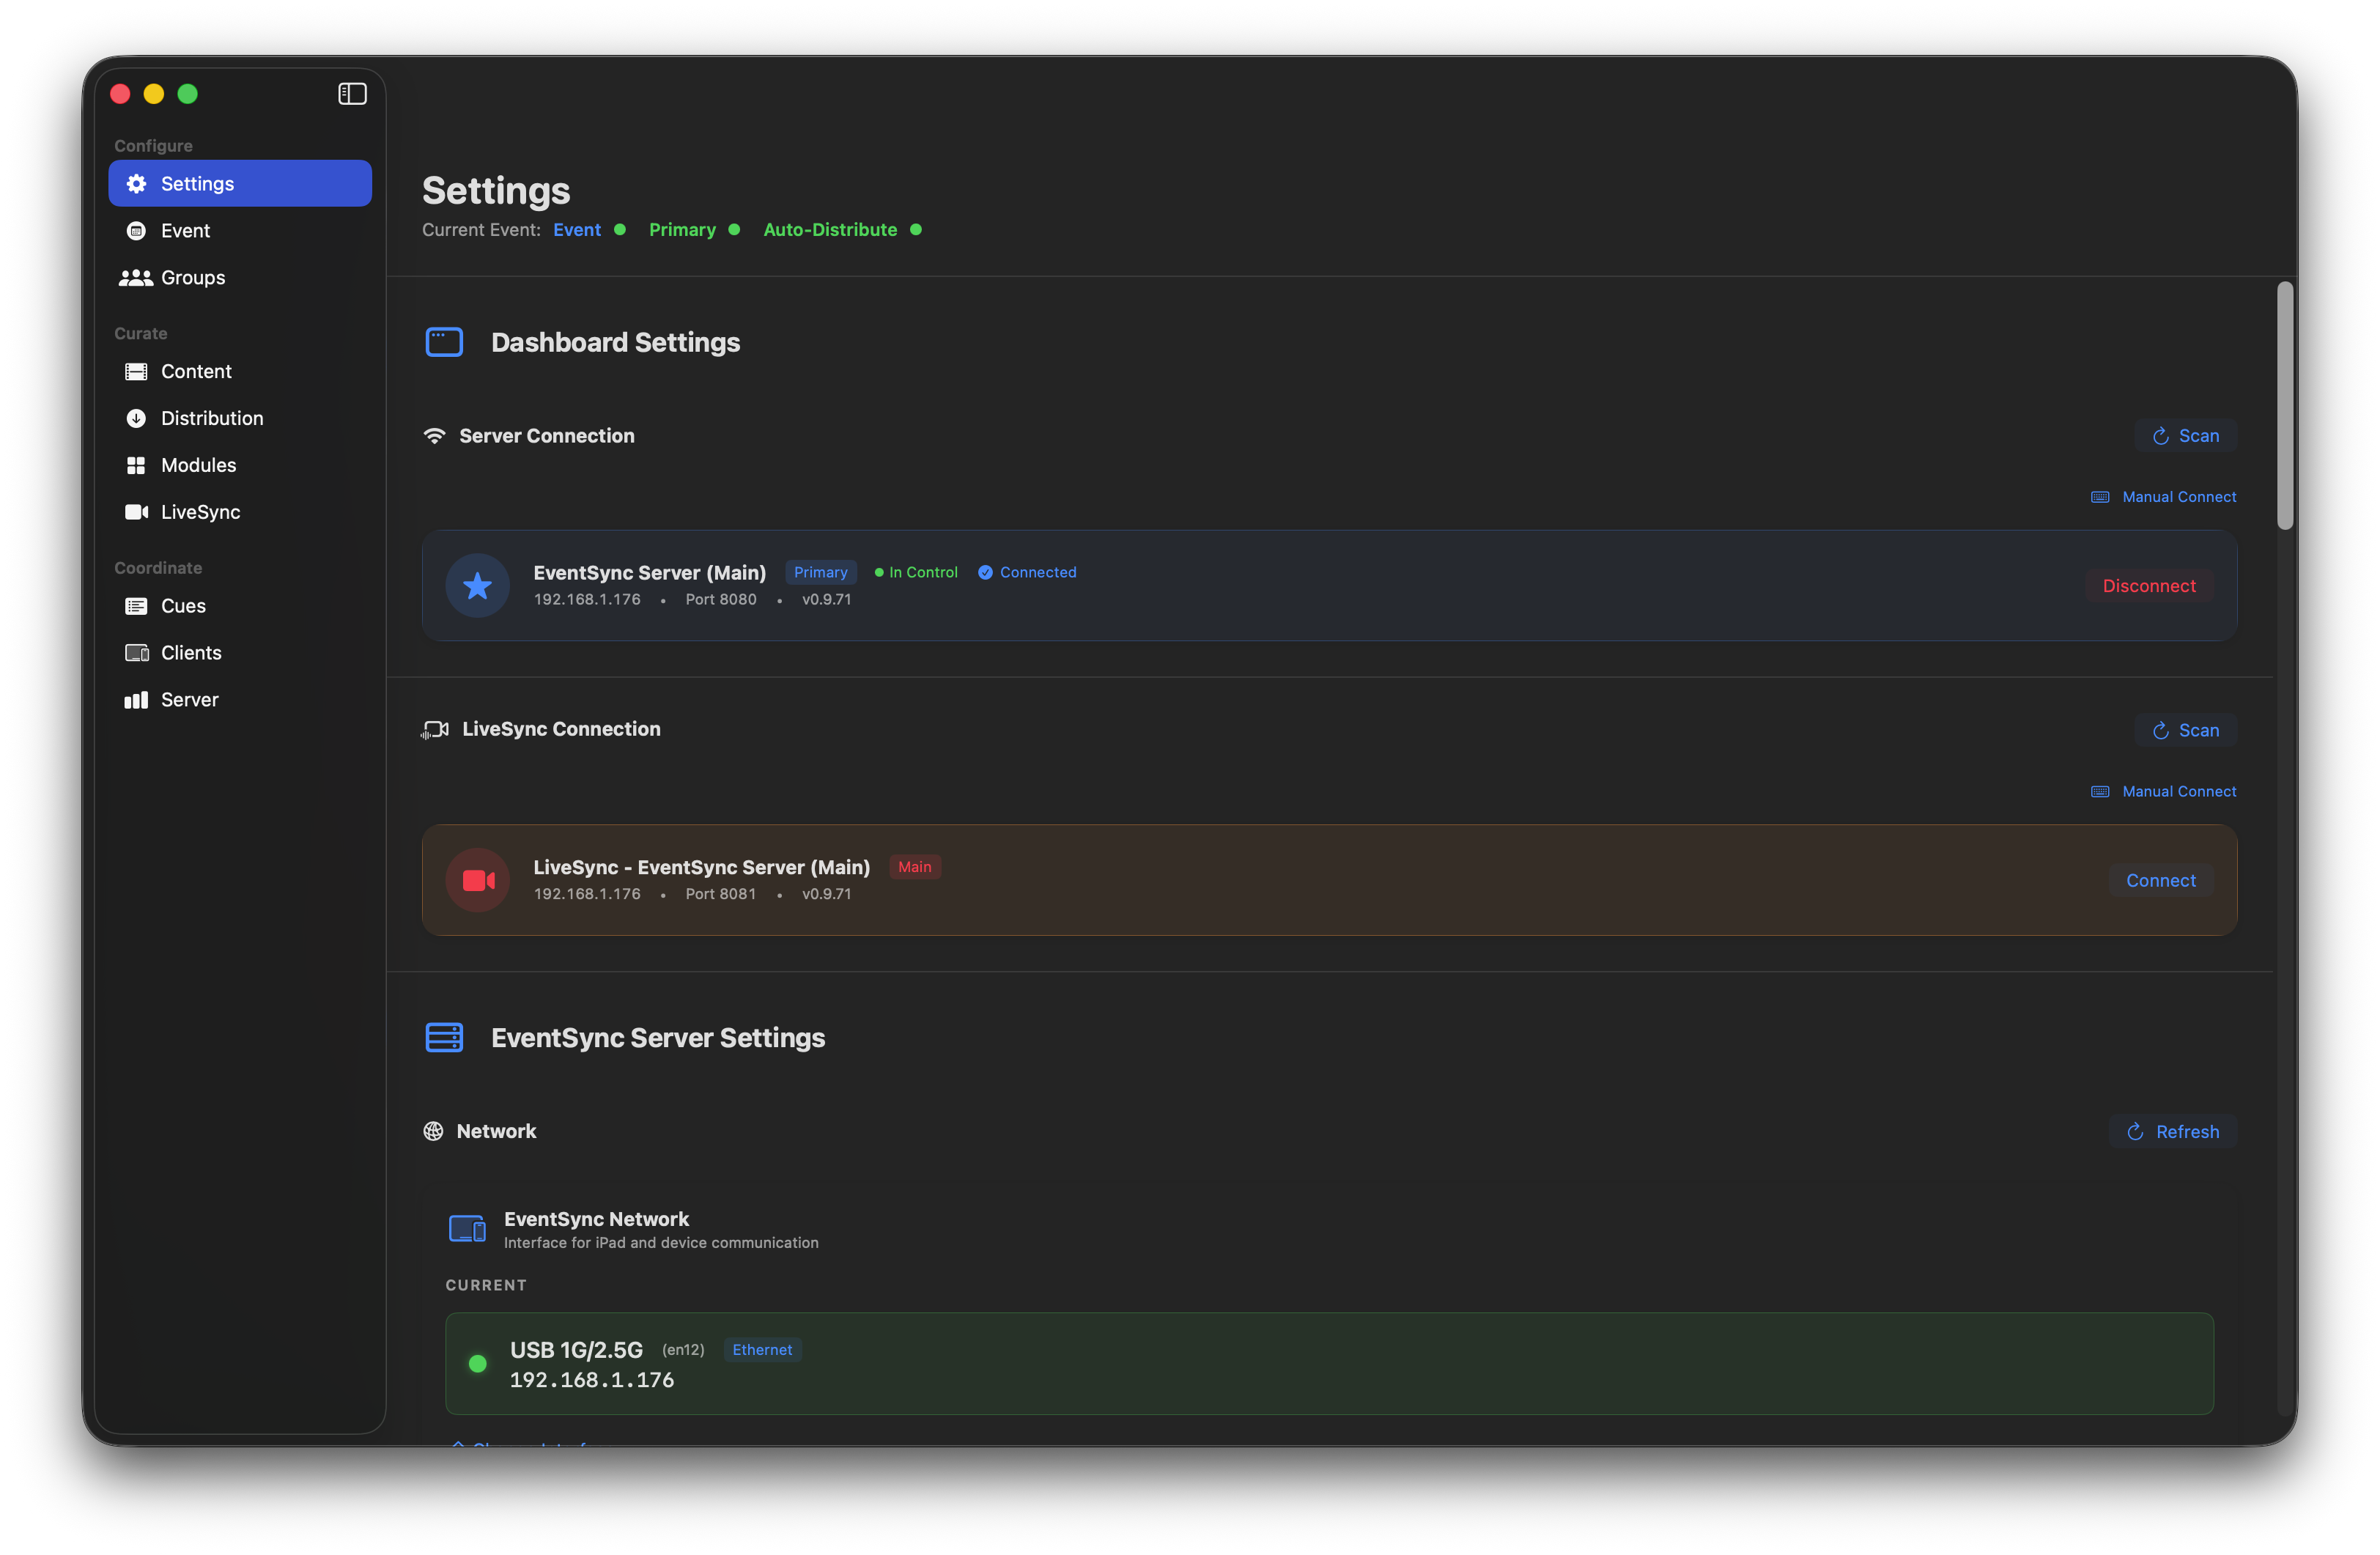
Once you've entered the PIN the Dashboard unlocks the full sidebar and shows the server as Primary · In Control · Connected.
Adding the LiveSync connection
LiveSync is a separate service and needs its own connection. Below the EventSync Server Connection card you'll see LiveSync Connection — click Connect to pair it with the LiveSync Server discovered on the network.
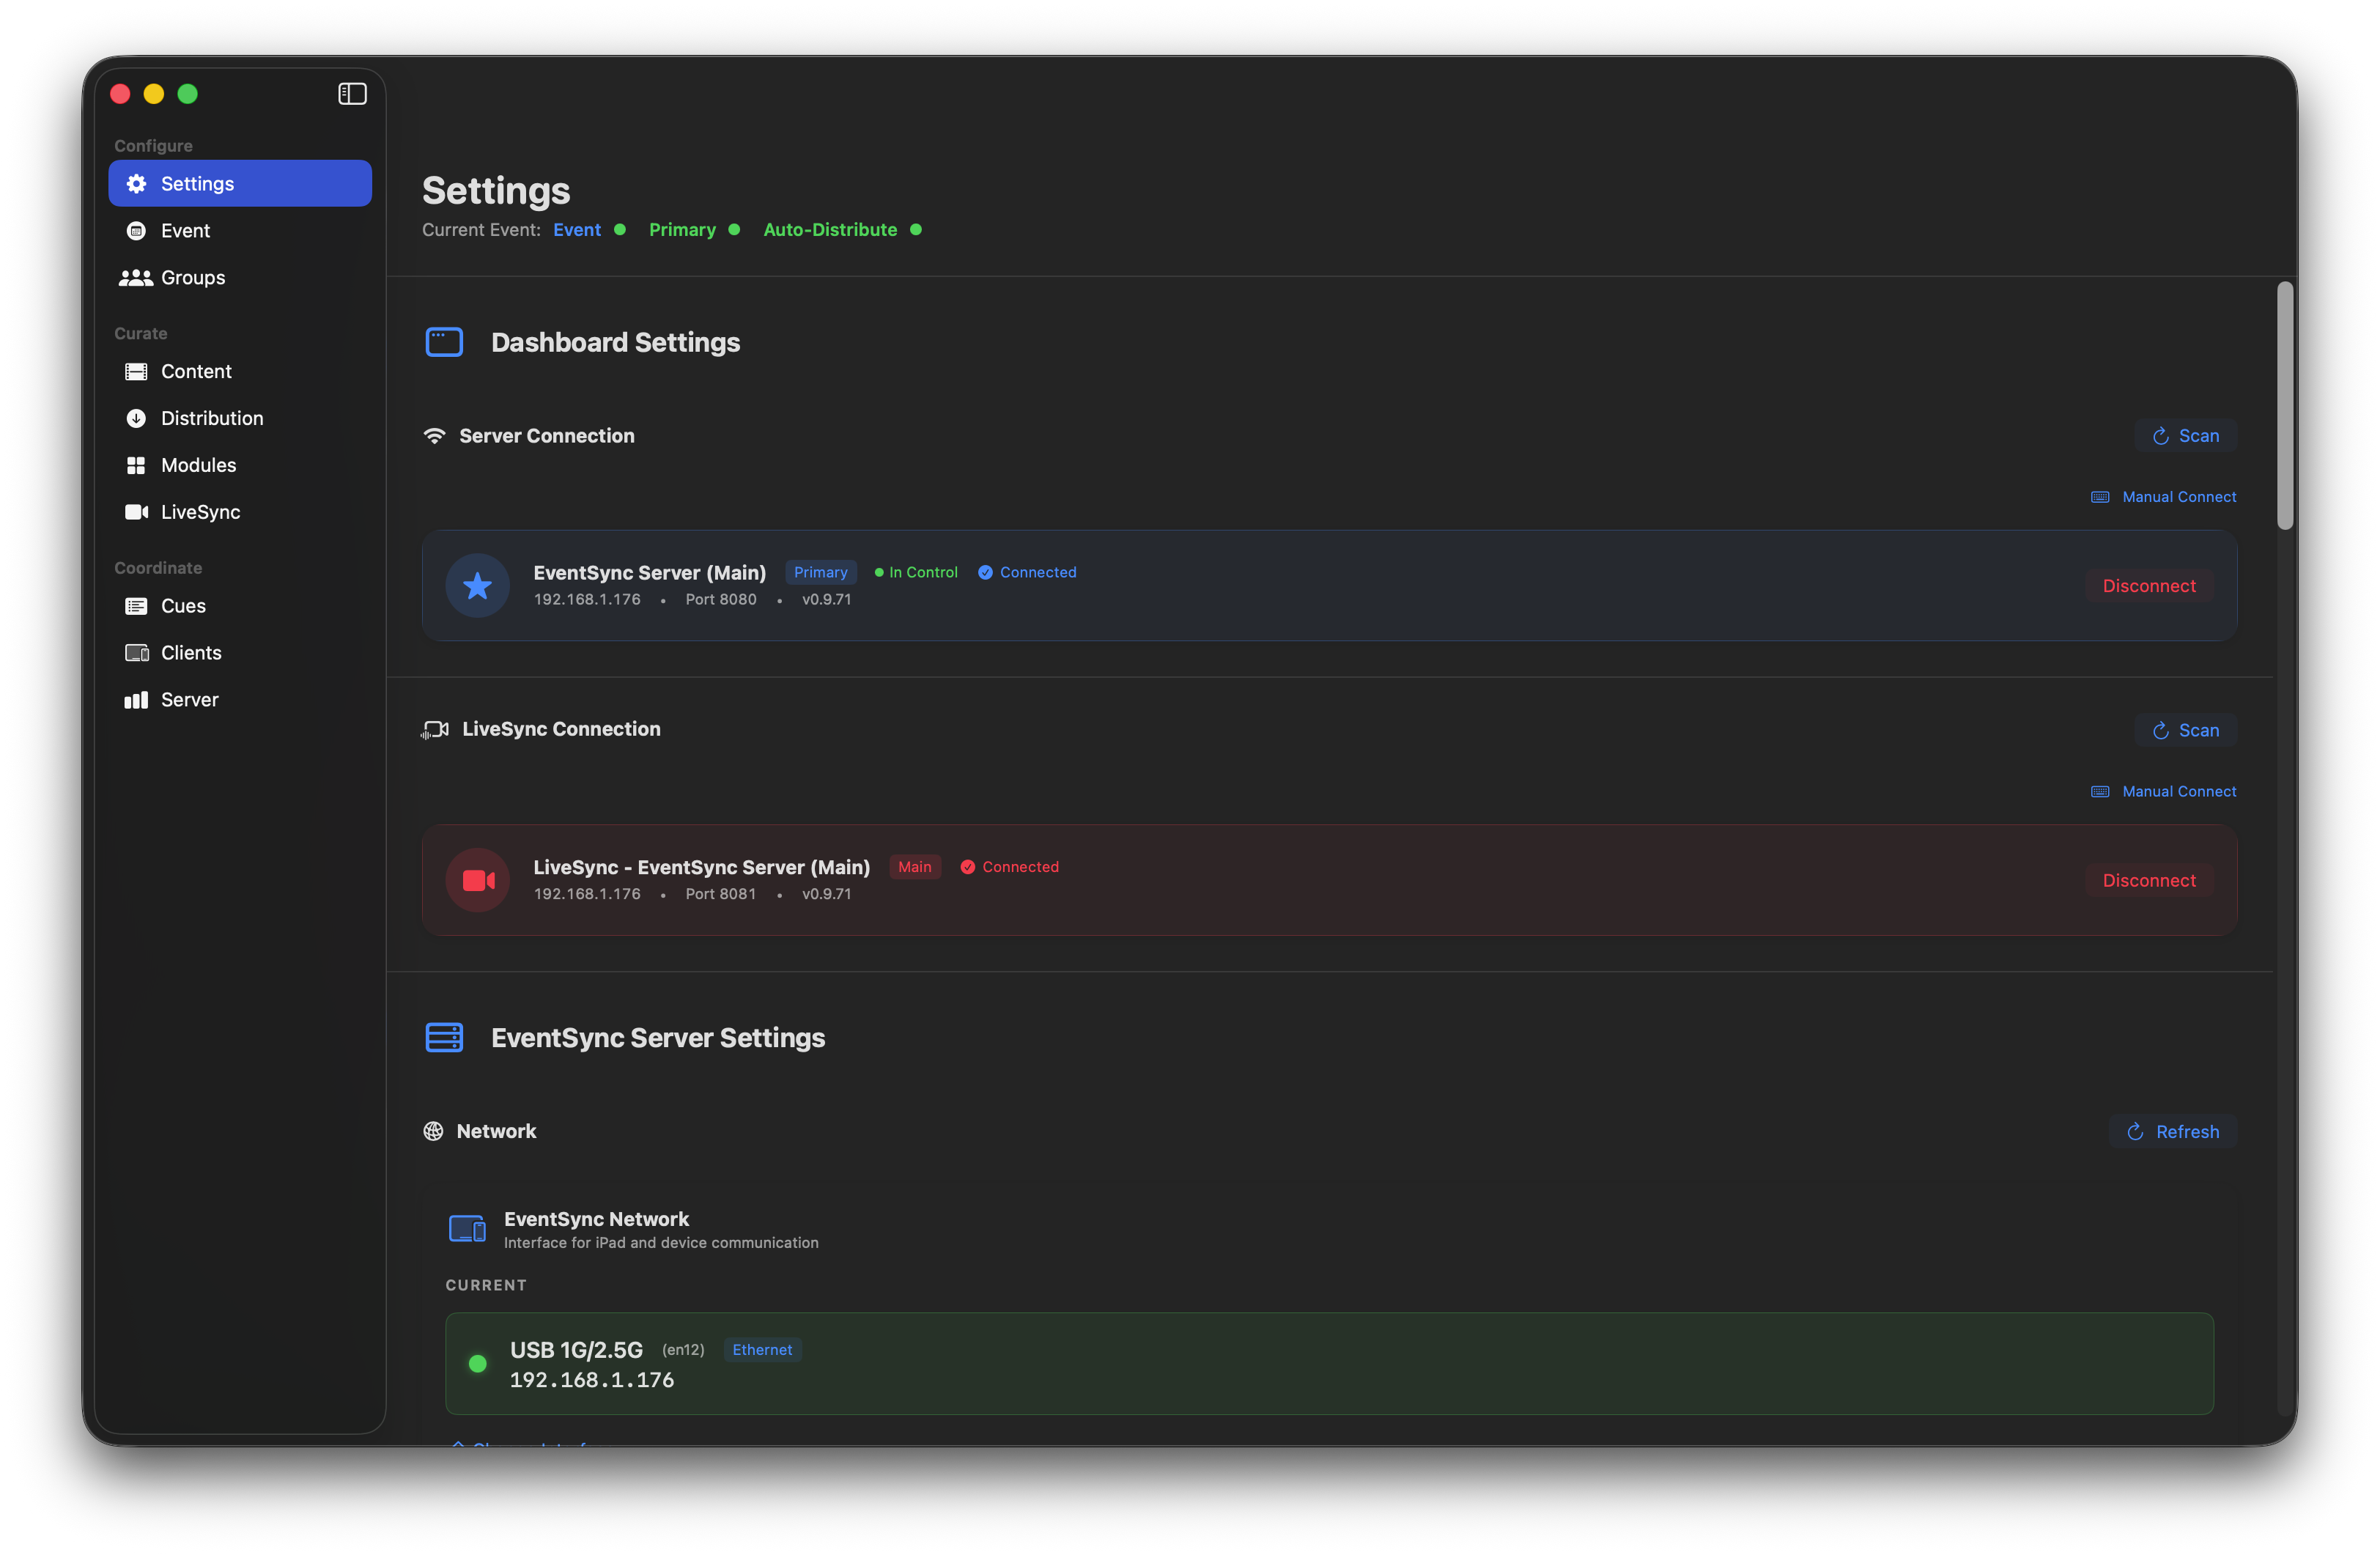
EventSync + LiveSync both connected. This is the normal operating state for a show using live video.
💡 Tip
If you're not using live video this evening, you don't need LiveSync connected. Leaving it disconnected is fine and uses fewer resources.
Network interfaces
Scroll down to EventSync Server Settings → Network. There are two interface configurations here:
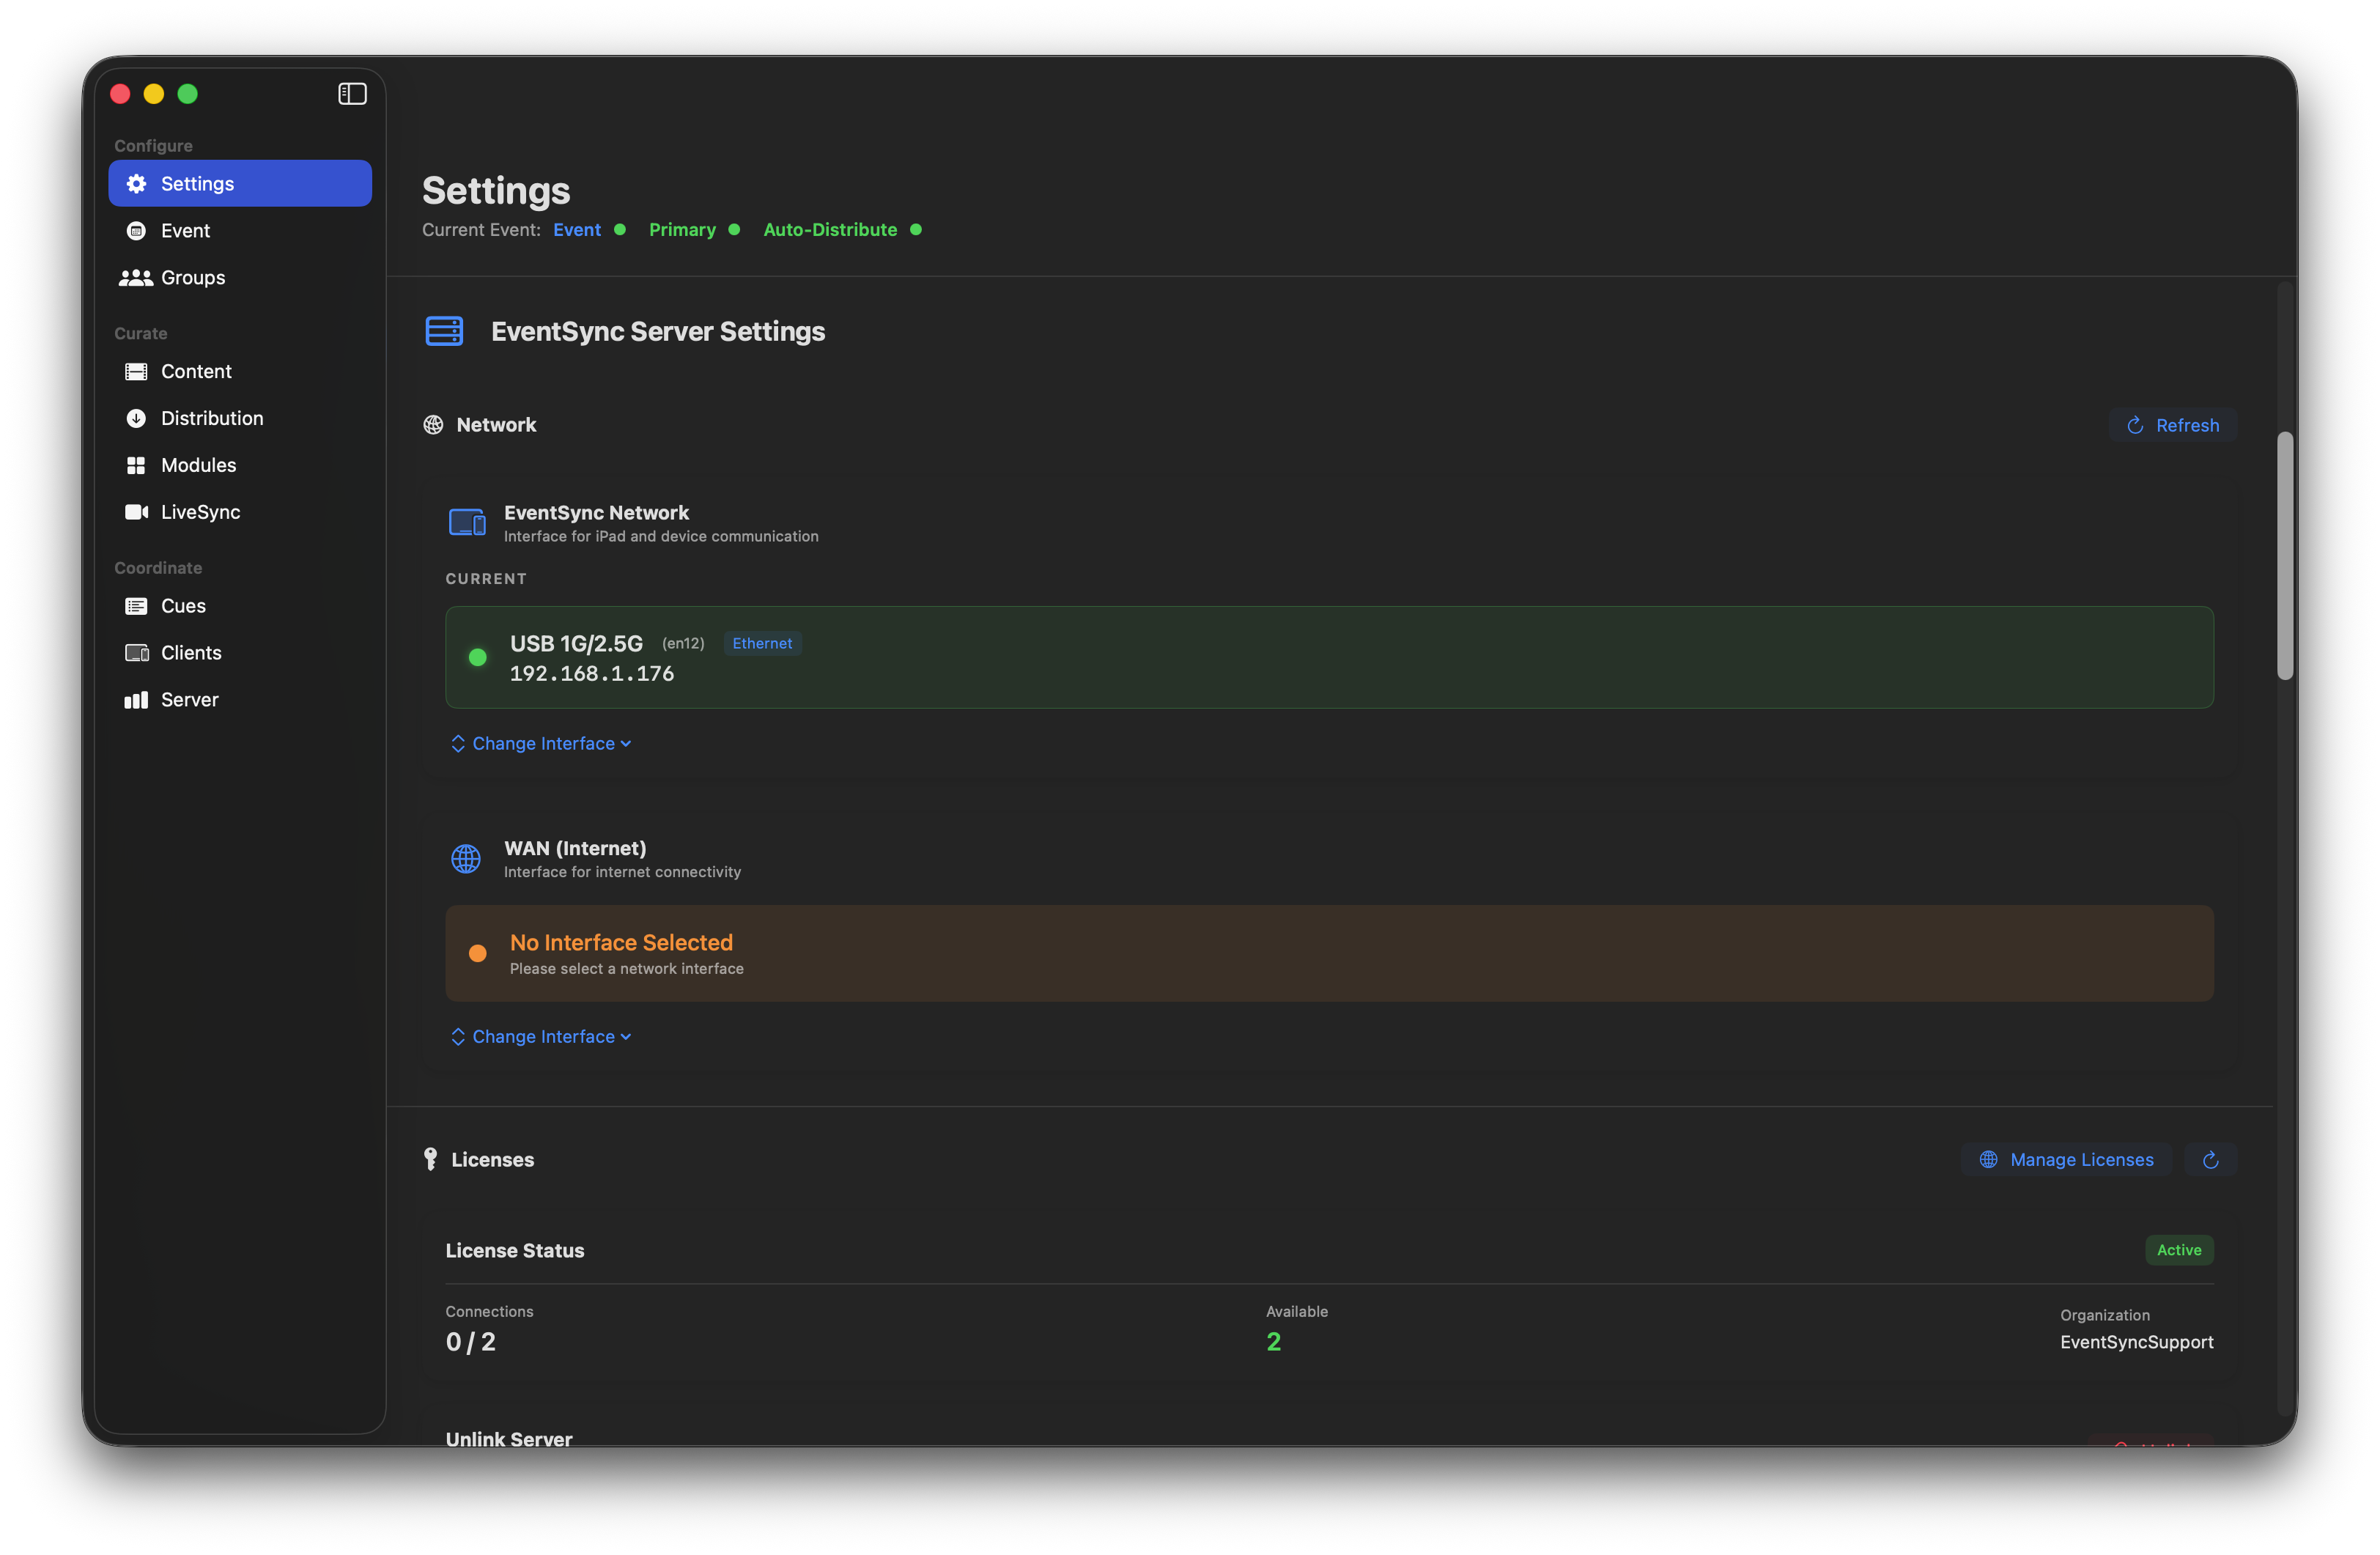
- EventSync Network — the interface devices talk to (same setting as the EventSync Server's Change Interface picker; this panel just lets you change it from the Dashboard). This should be your dedicated event network.
- WAN (Internet) — a separate interface used for licensing, updates and (optionally) Show Control / Companion. Typically the Mac's built-in Wi-Fi connected to venue internet.
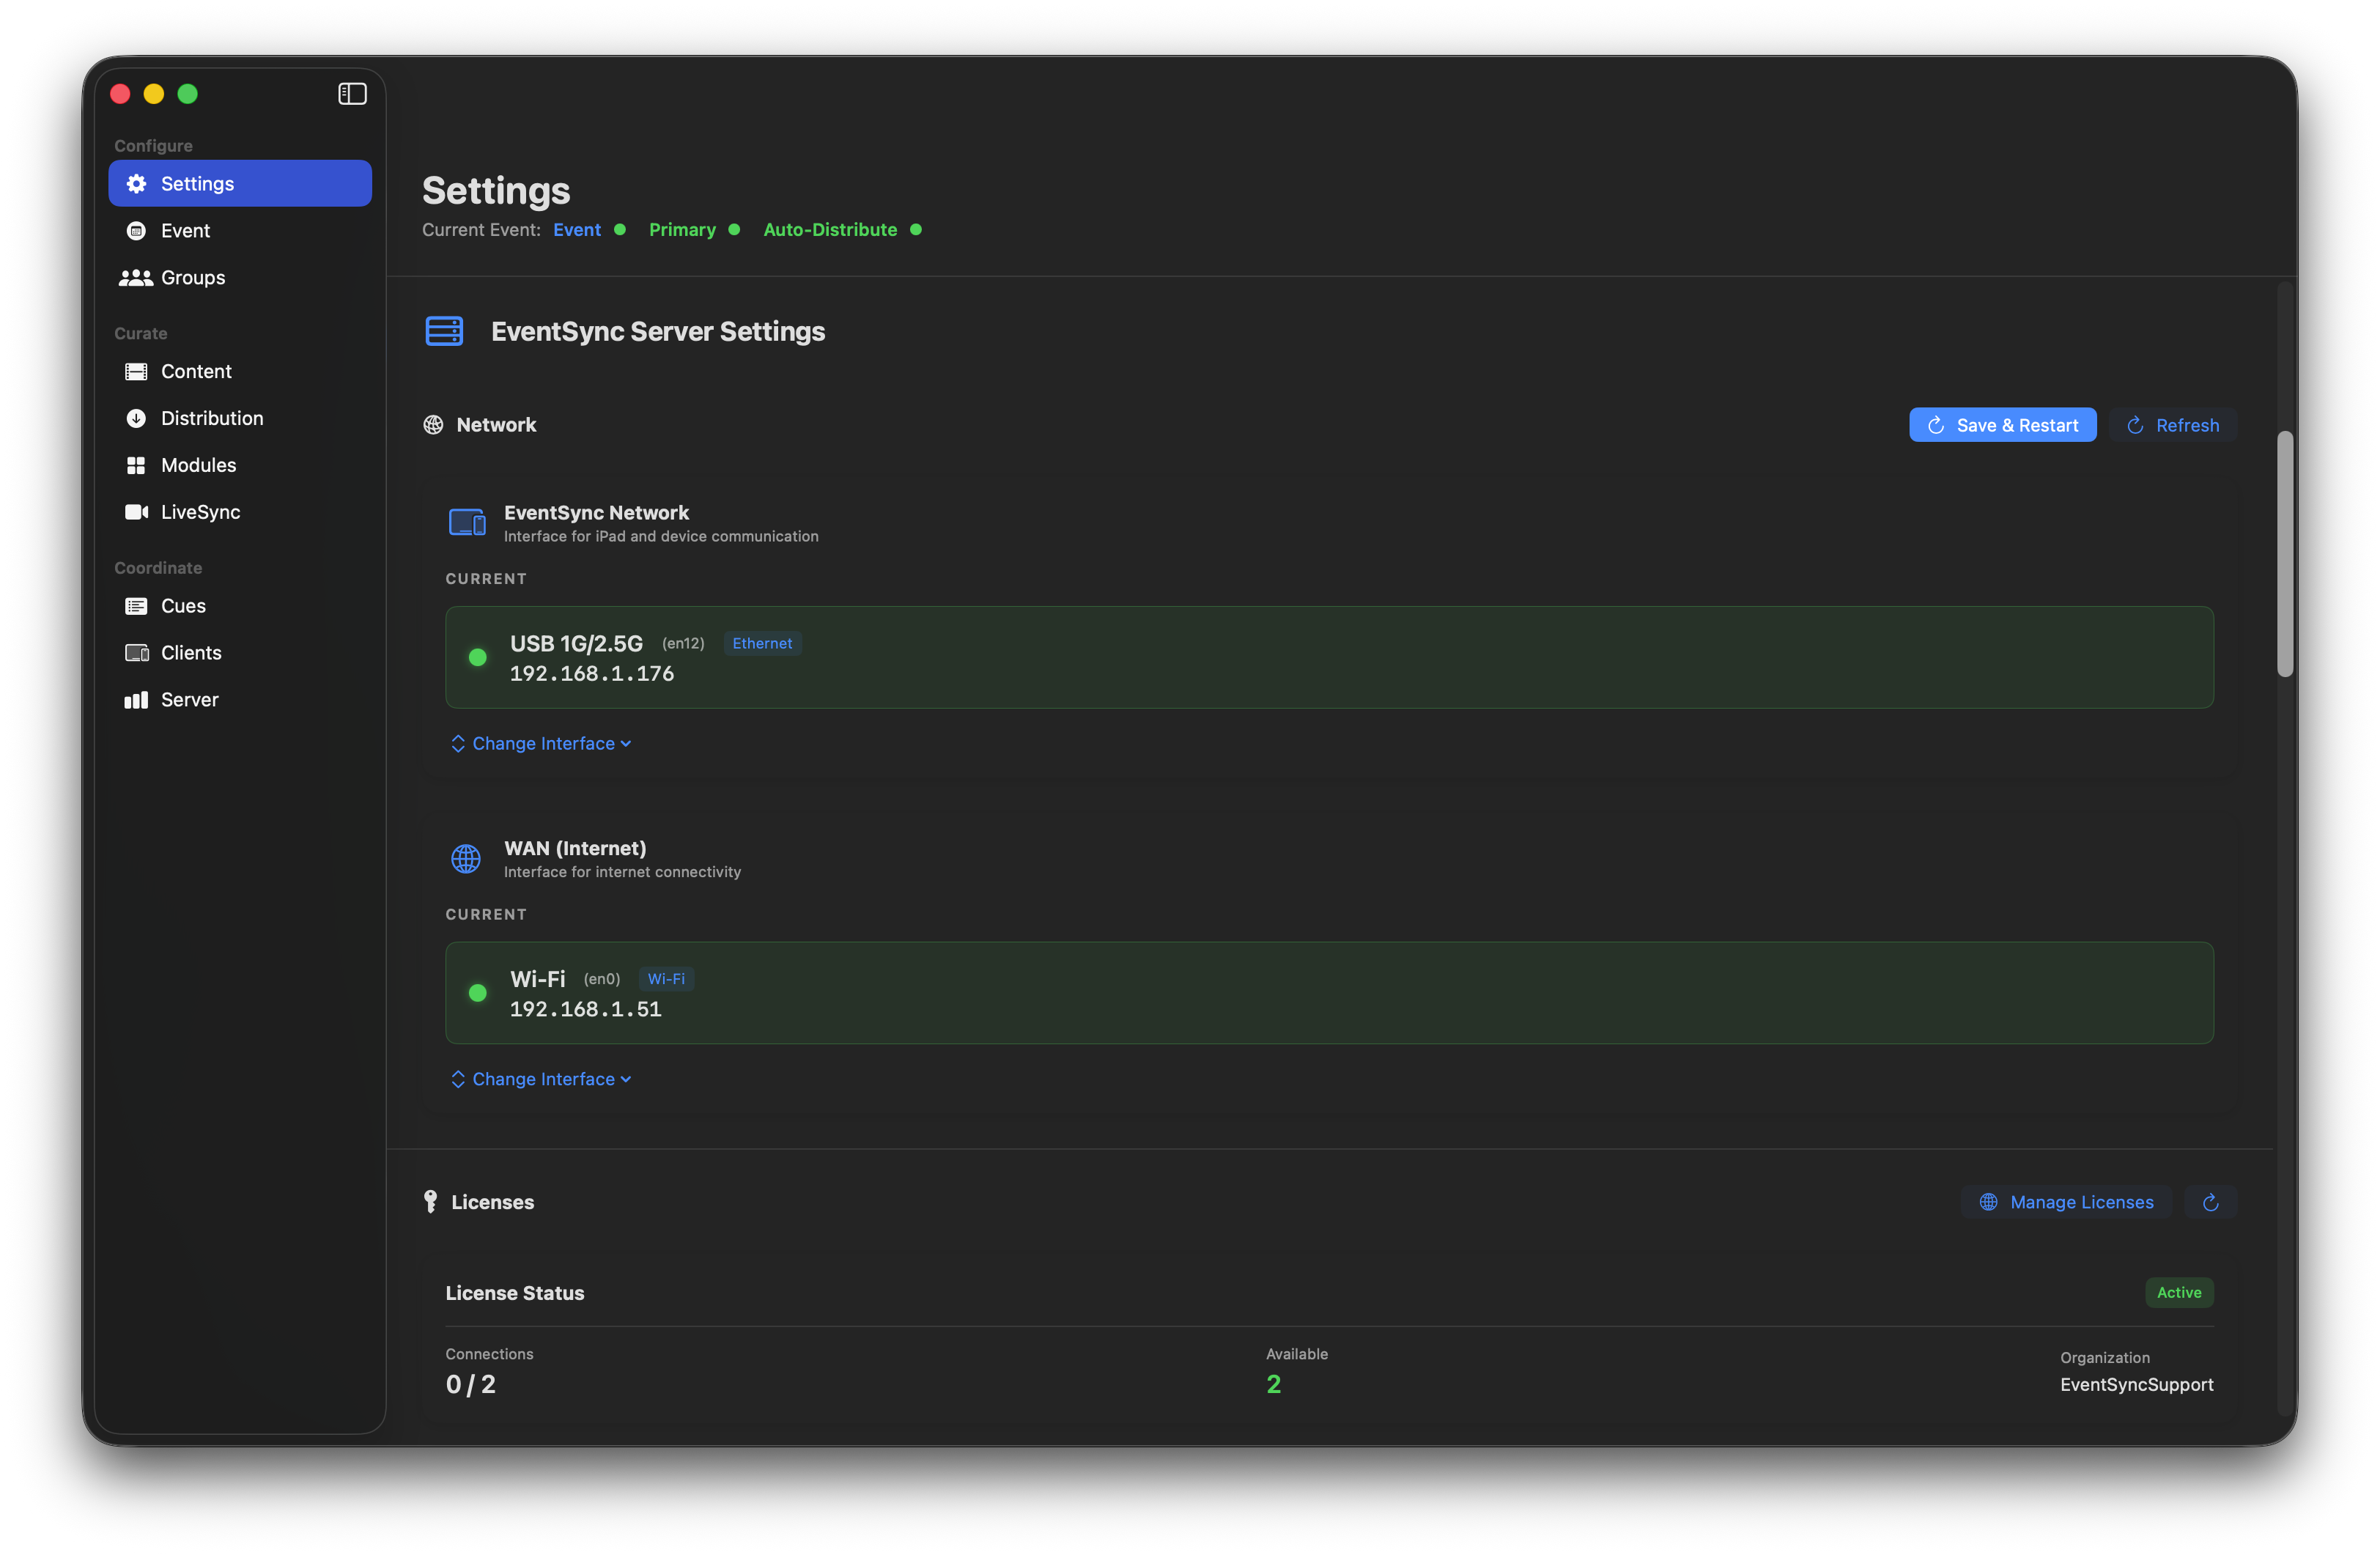
Both interfaces chosen — Save & Restart to apply.
💡 Best Practice — dual network
Keep devices and internet on separate interfaces. This insulates the event network from venue internet issues, keeps content downloads on the fast local link, and — crucially — isolates devices from the public internet. With no outbound route, devices can't trigger iOS updates, surface push notifications or accept incoming FaceTime calls mid-show.
Client App Settings
Further down Settings you'll find Client App Settings — these apply to every device that connects to this server.
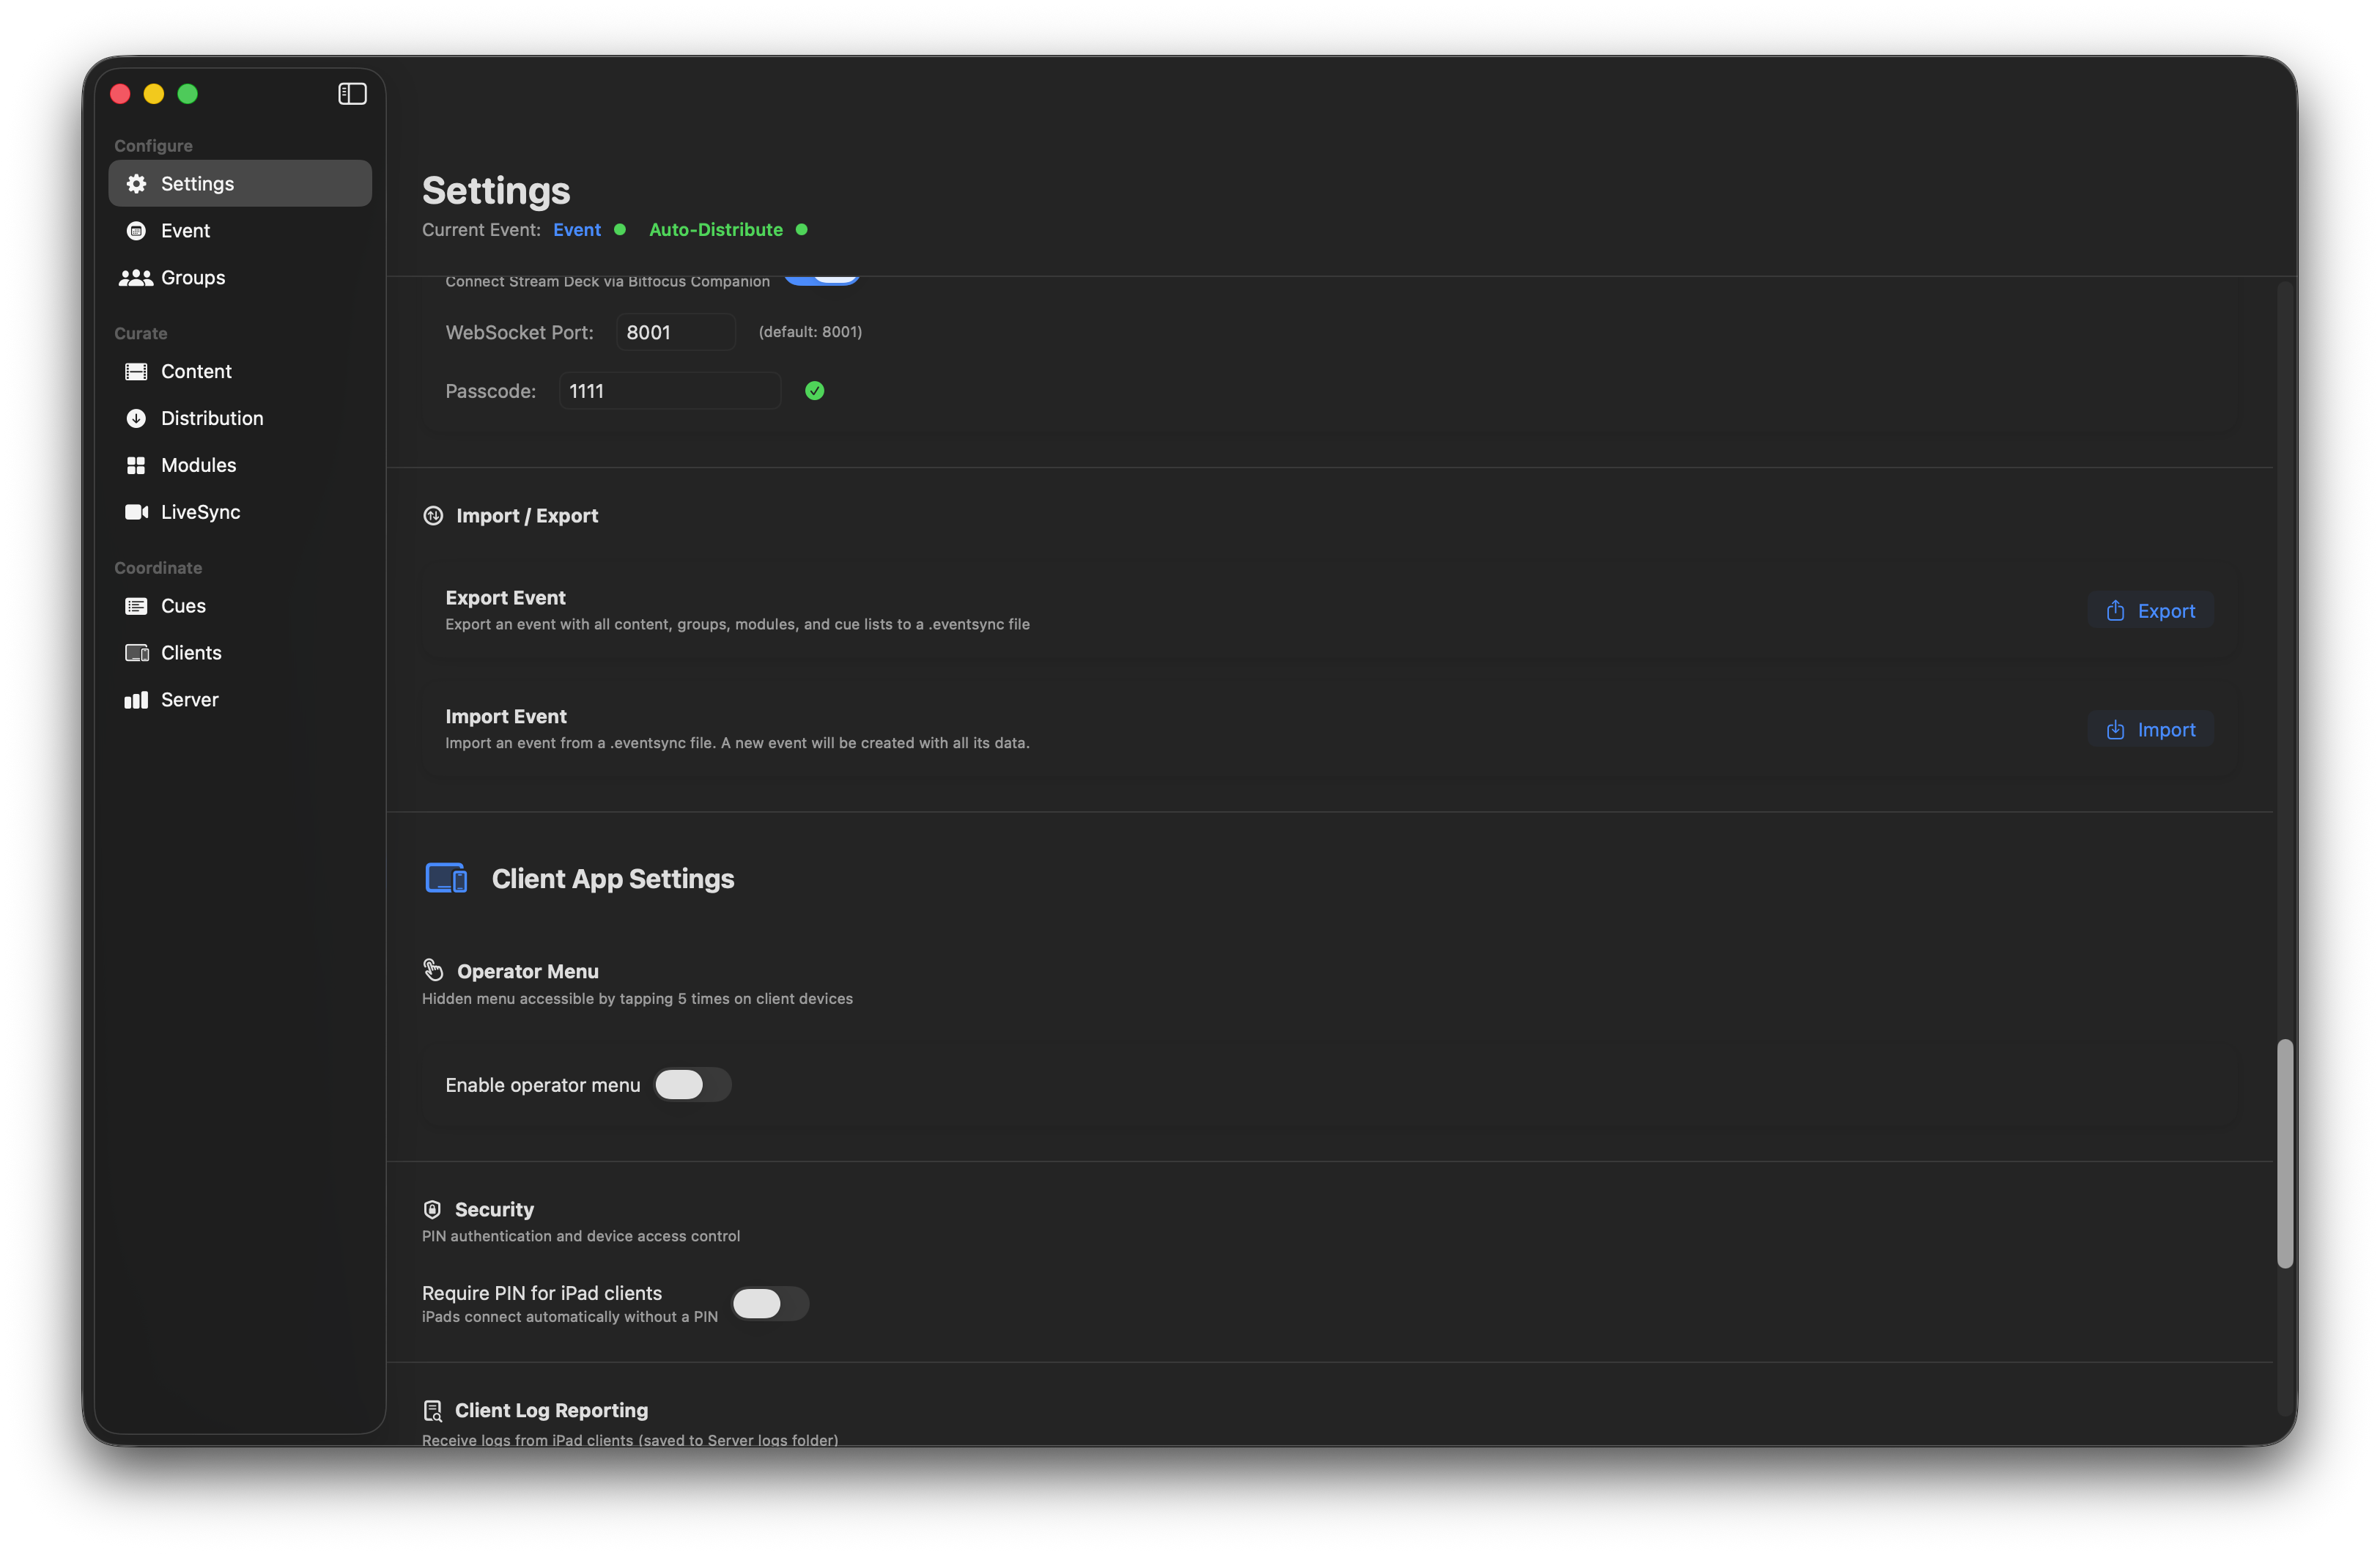
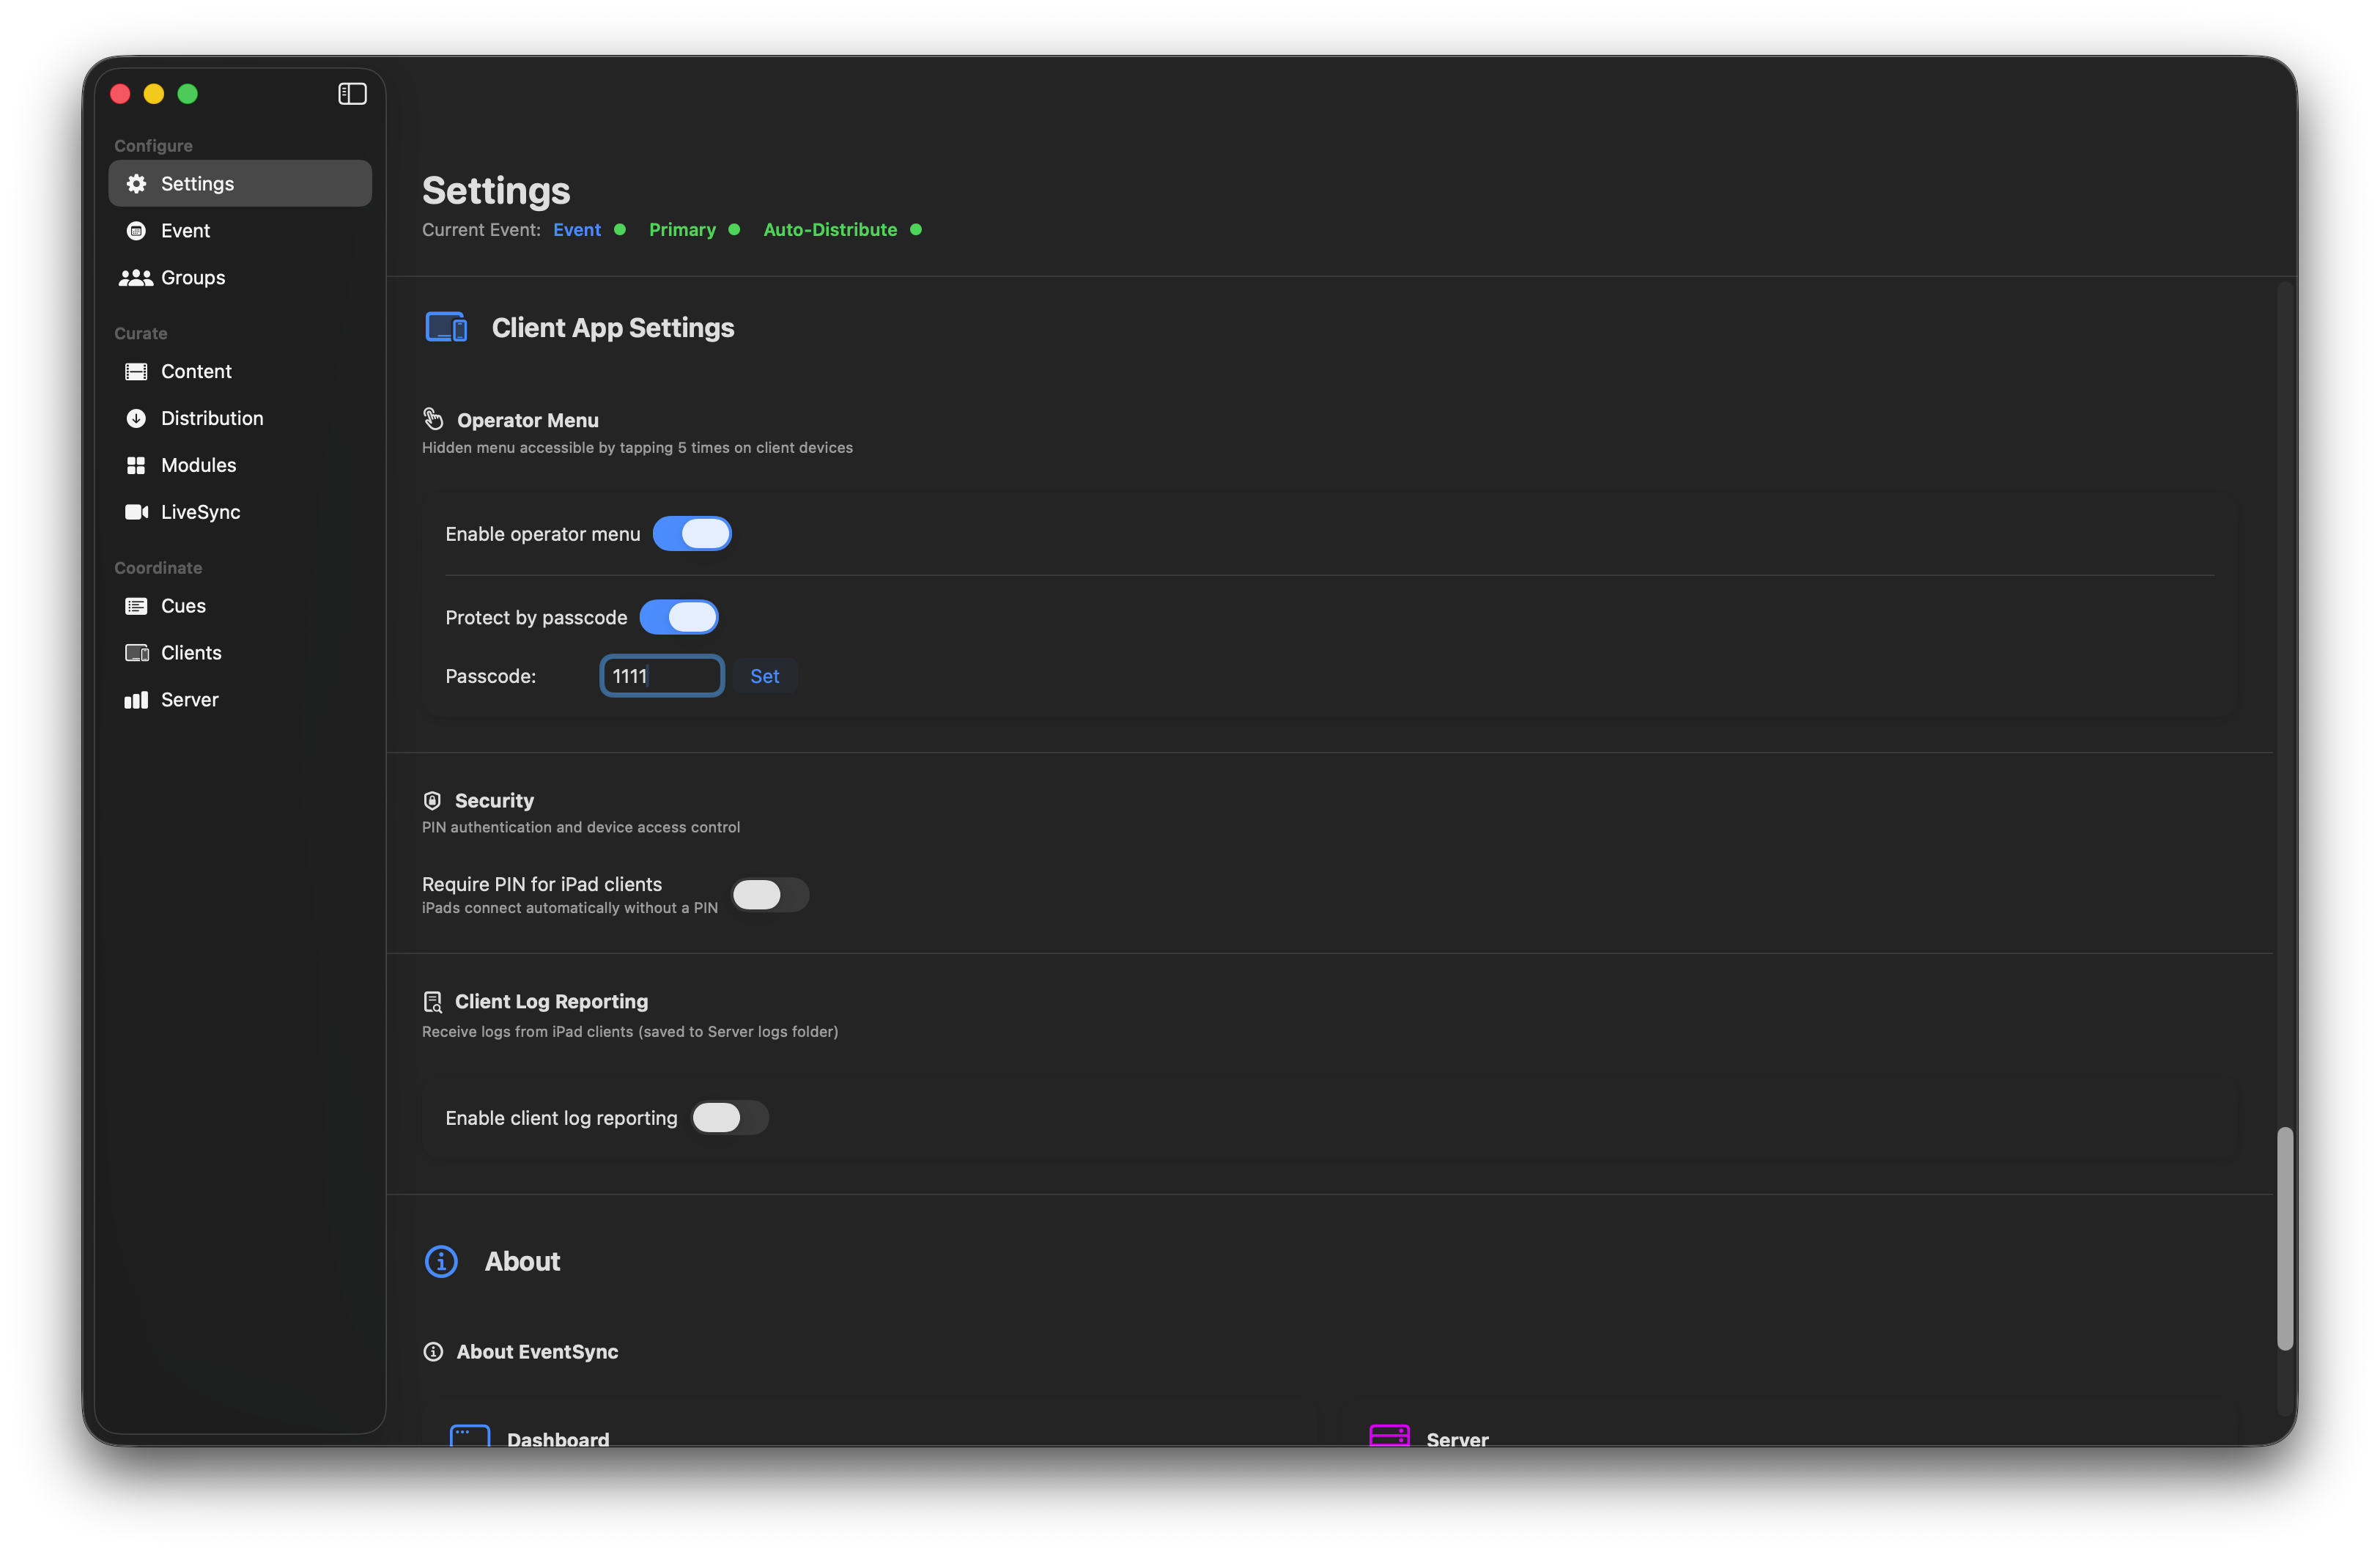
Operator Menu
The Operator Menu is a hidden menu on each device used by crew during setup — ungroup device, identify on Dashboard, clear cached content. Guests never see it.
- Enable operator menu — turns the hidden menu on.
- Protect by passcode — require a passcode to open it. There is no default passcode; you choose one. Any 4-digit code works.
- Gesture — tap 5 times anywhere on the device screen to open the menu.
💡 Best Practice — enable for setup, disable for live
Enable the Operator Menu during build and rehearsal so your crew can ungroup / identify / clear cache quickly. Disable it when the doors open so a curious guest tapping five times on a table device can't change its state. Flip it back on if you need to intervene, then off again.
Require PIN for iPad clients
By default, devices connect automatically to any EventSync server advertising on the network. Turning Require PIN for iPad clients on makes devices prompt for the server PIN before joining — useful when multiple EventSync shows share a venue or when you want a deliberate barrier.
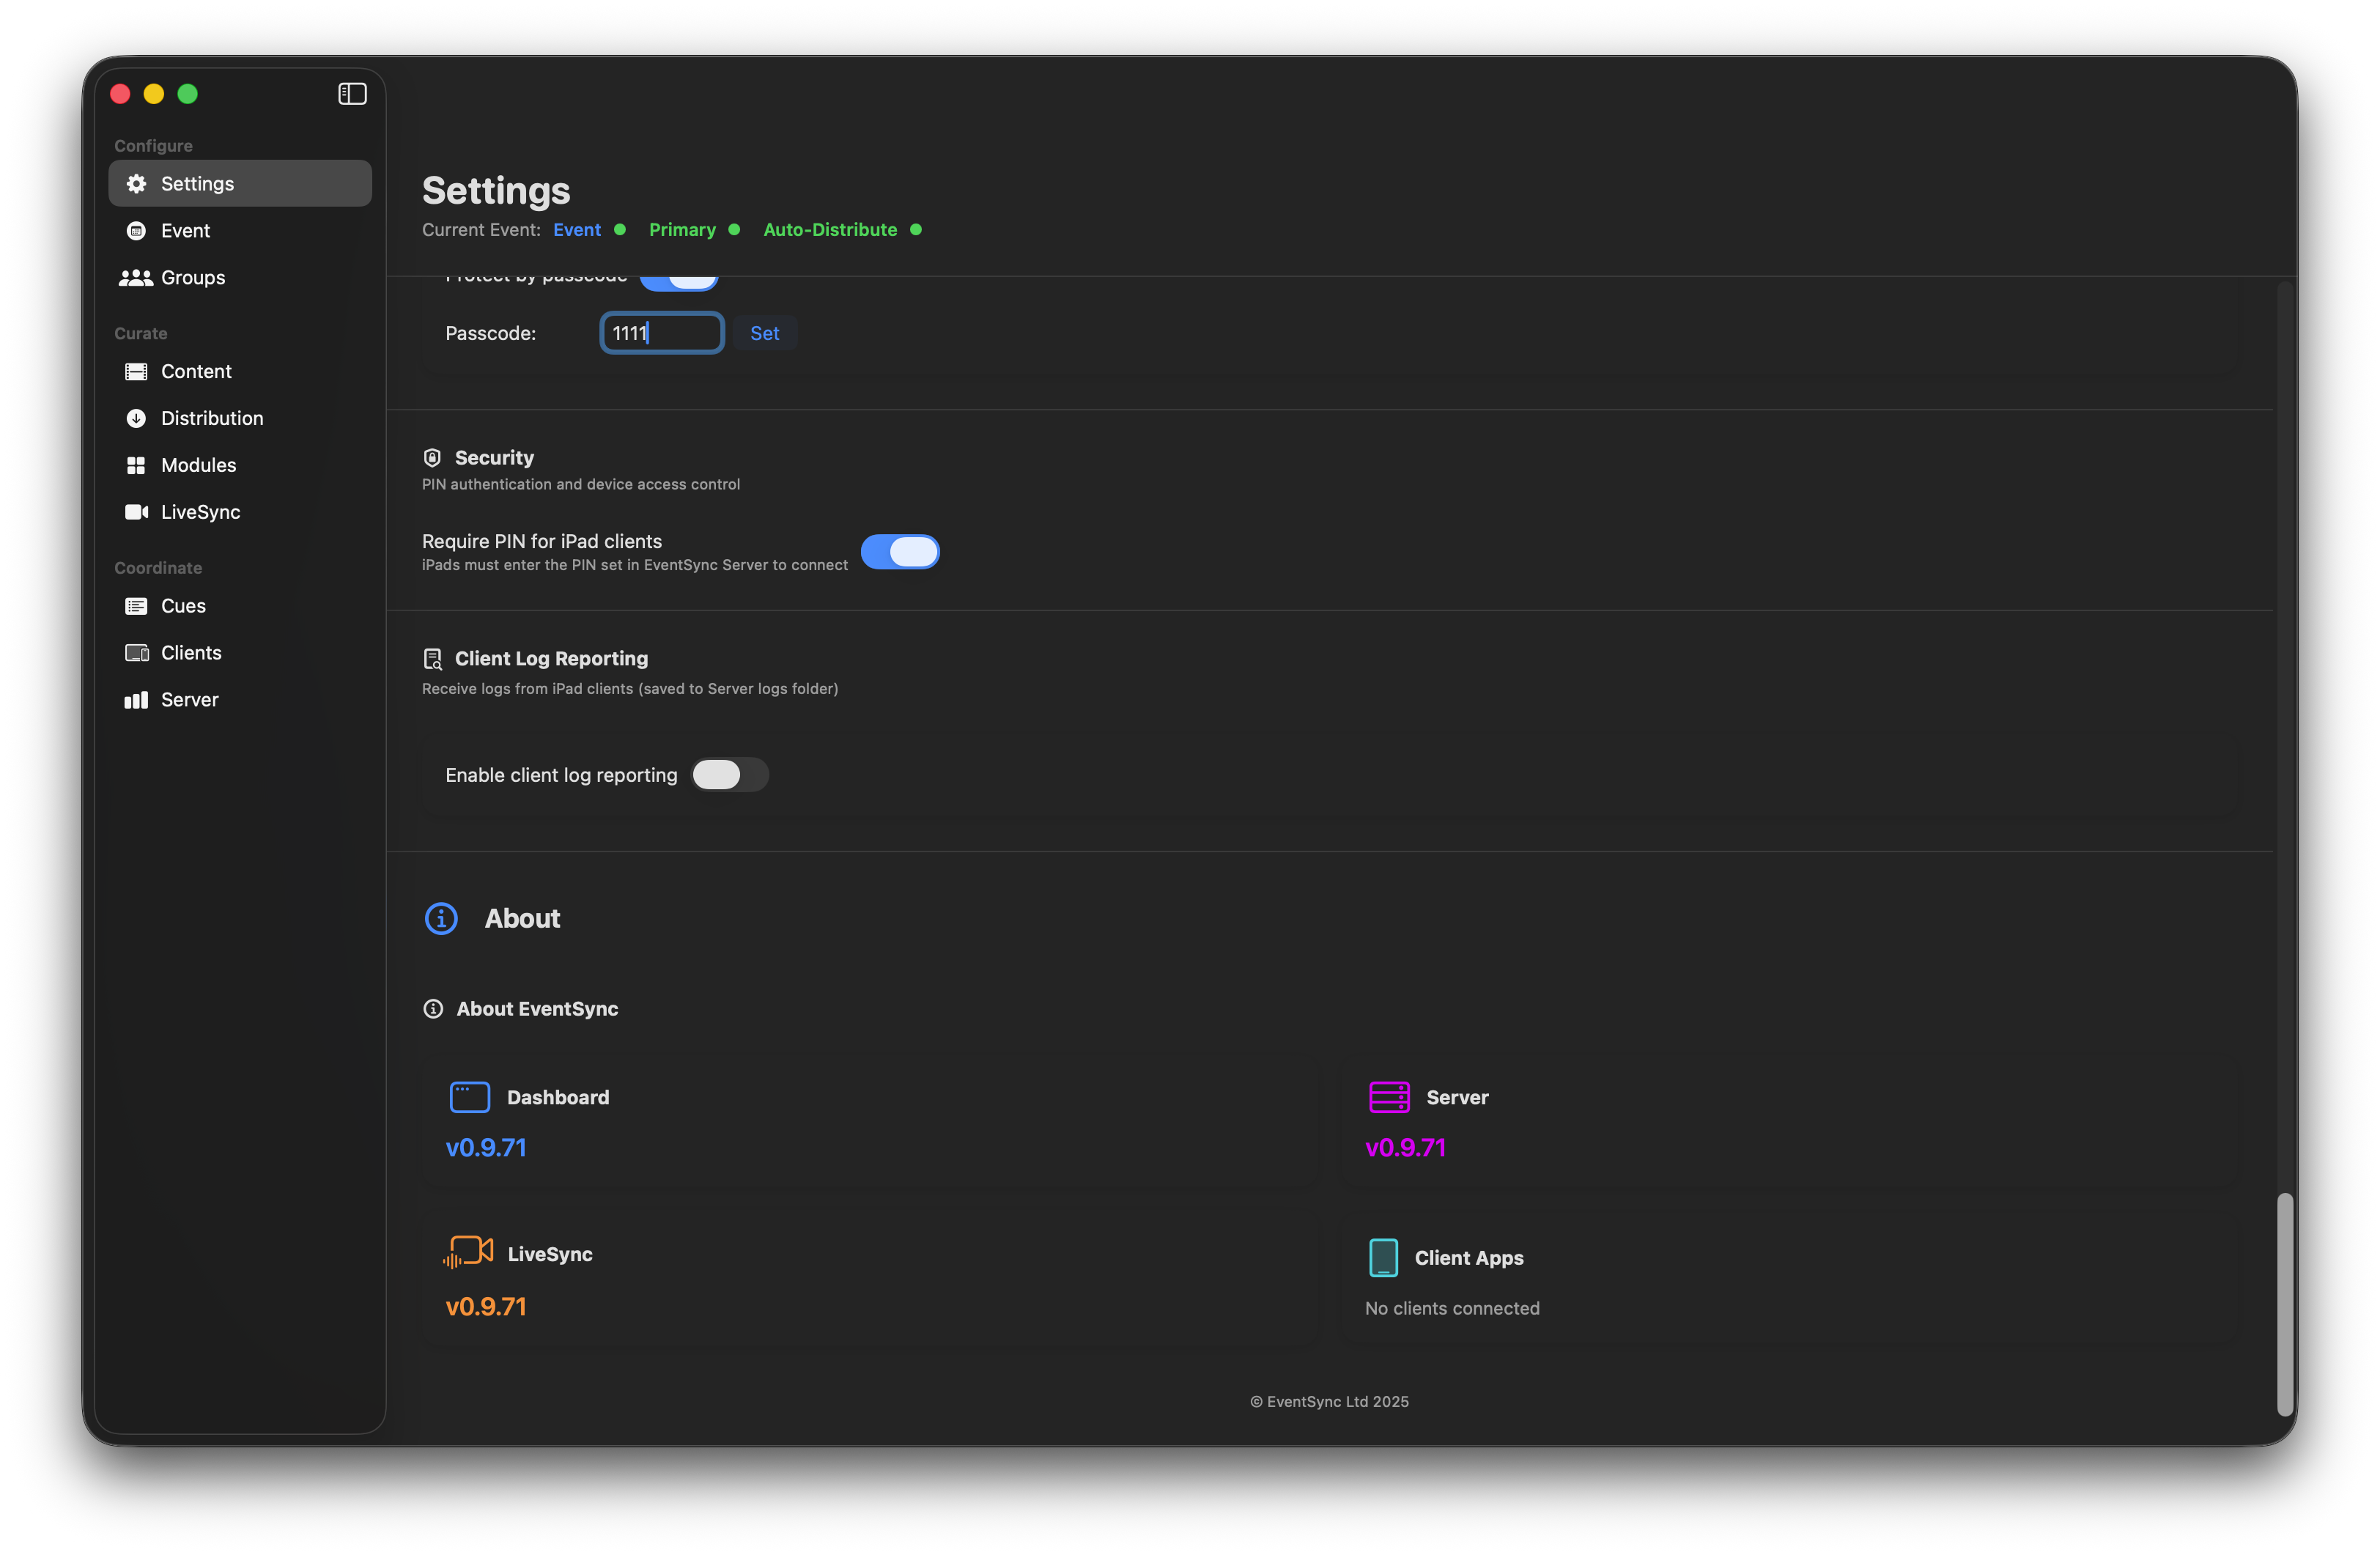
Client Log Reporting
Normally devices keep their logs to themselves. Enable Client Log Reporting and connected devices stream their logs over Wi-Fi into the server's own log, giving you easy diagnostics and a single bundle to upload to support.
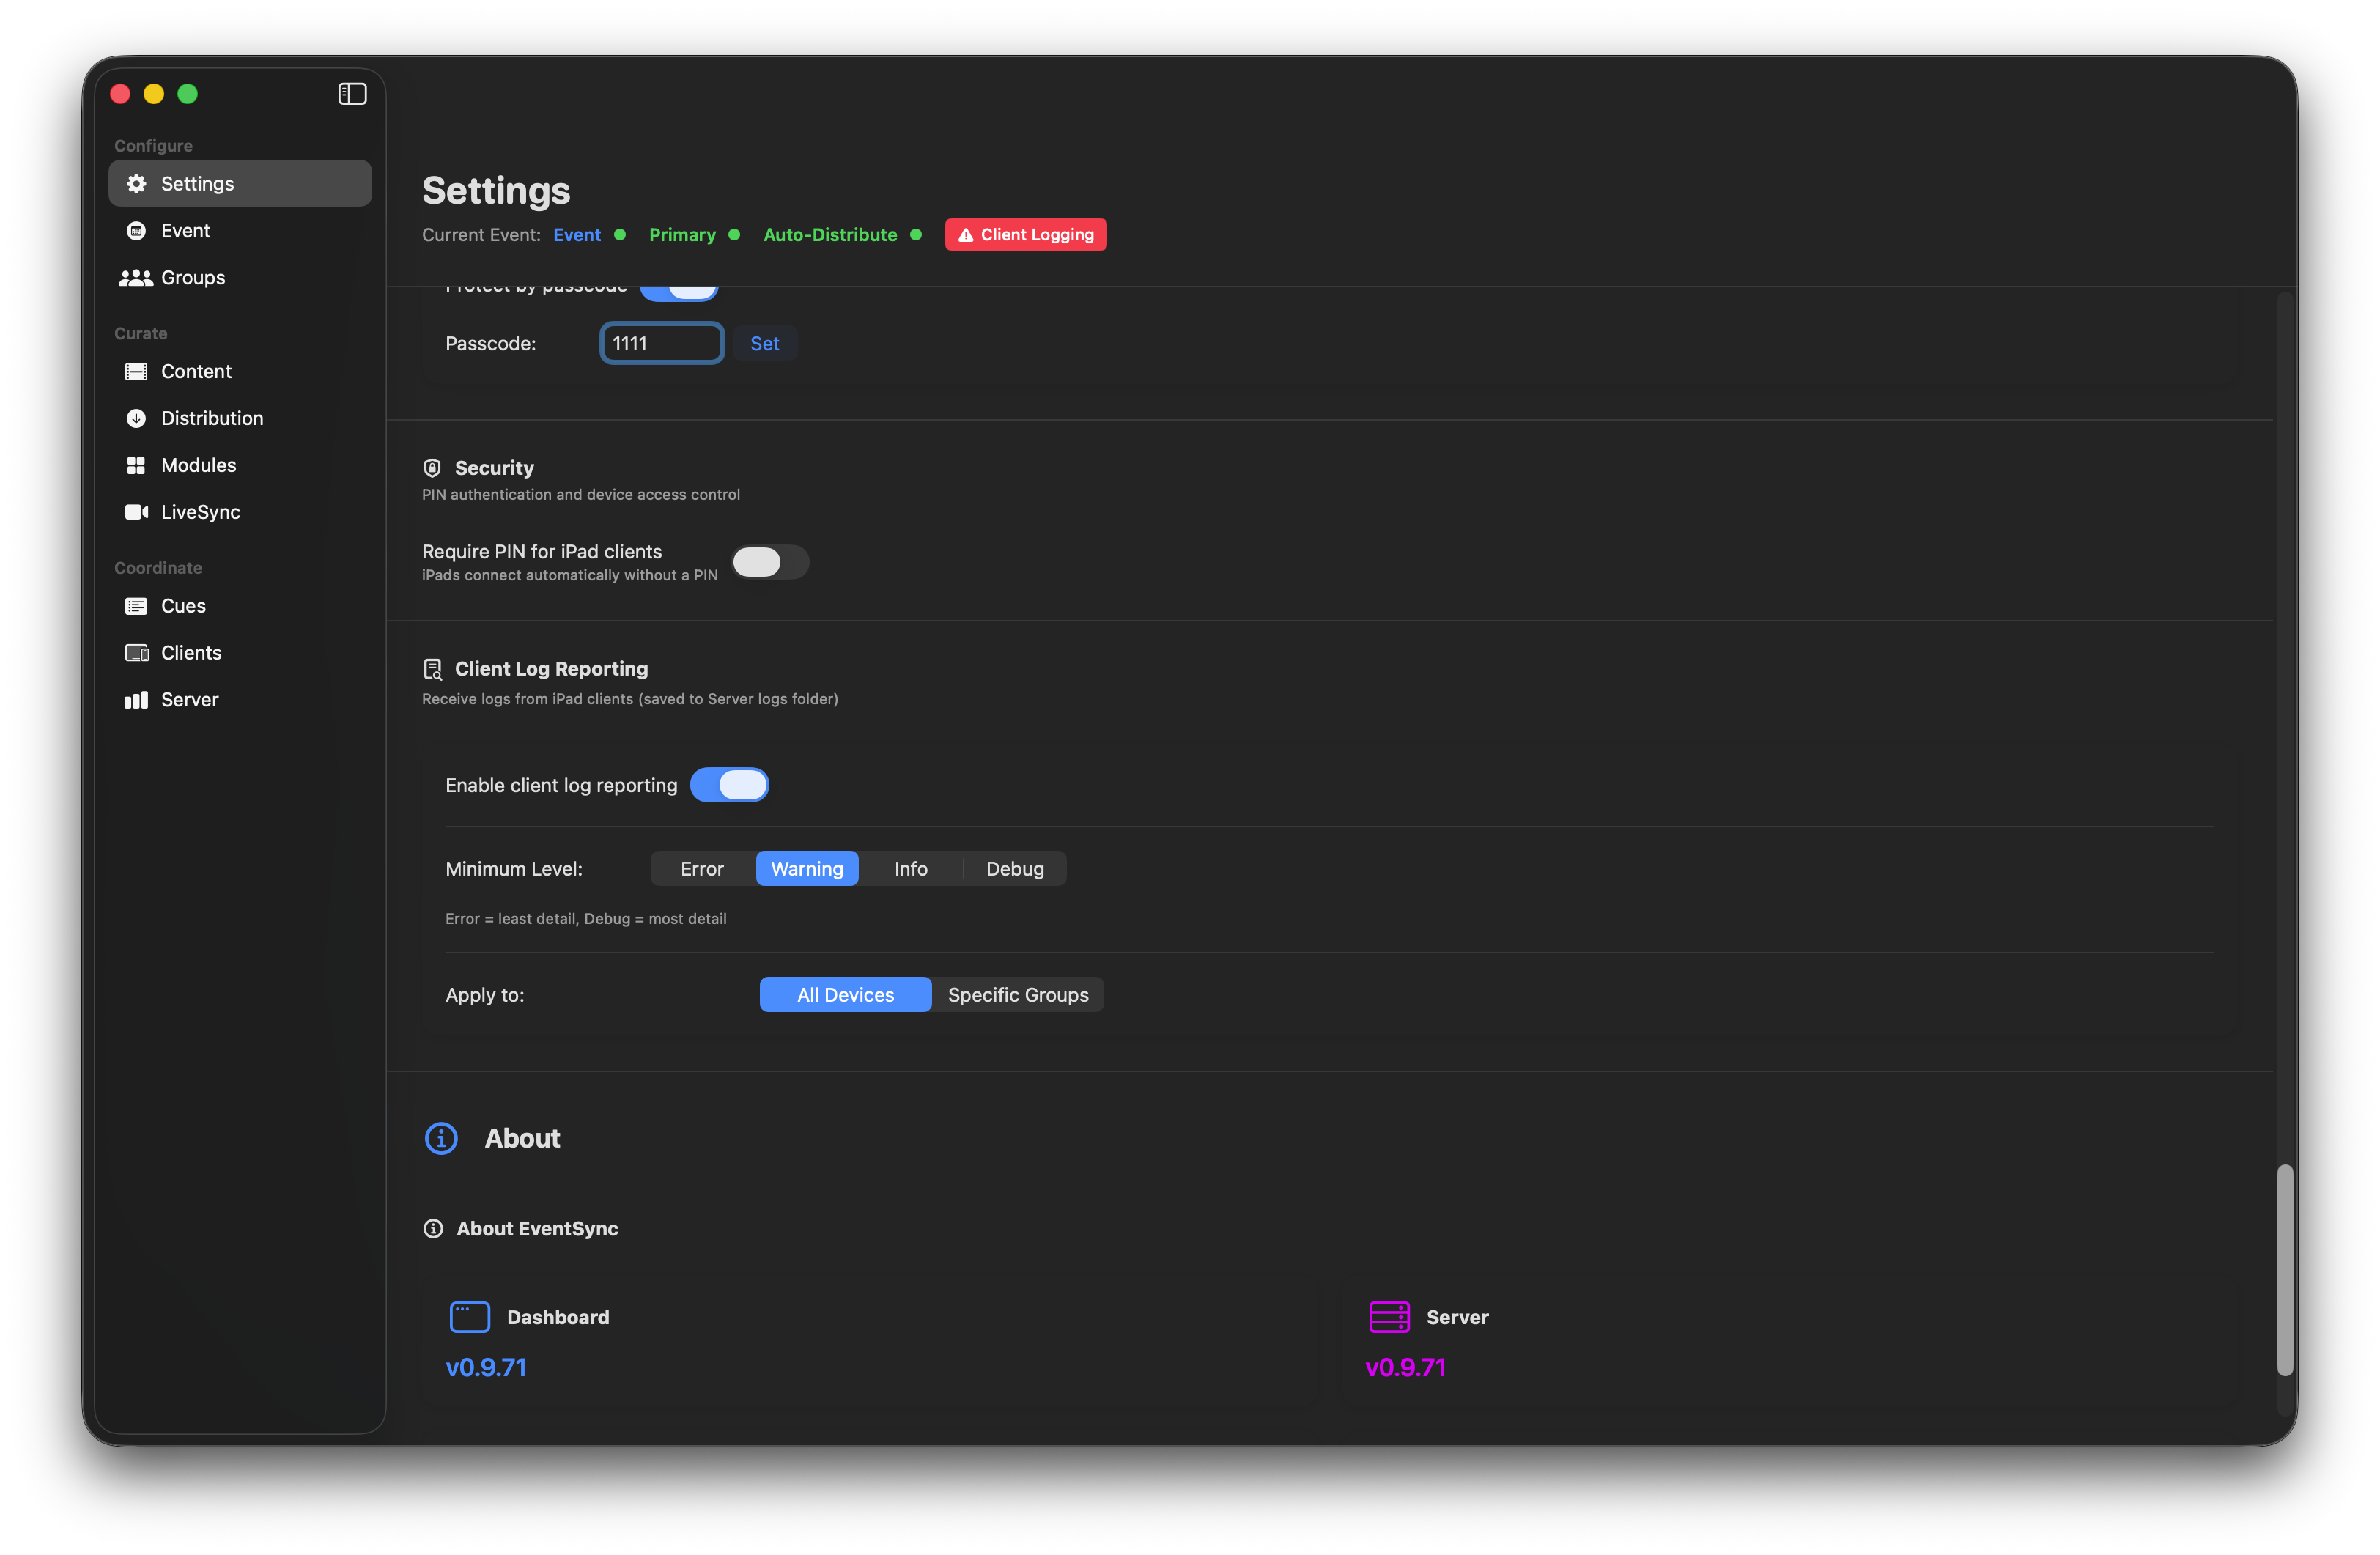
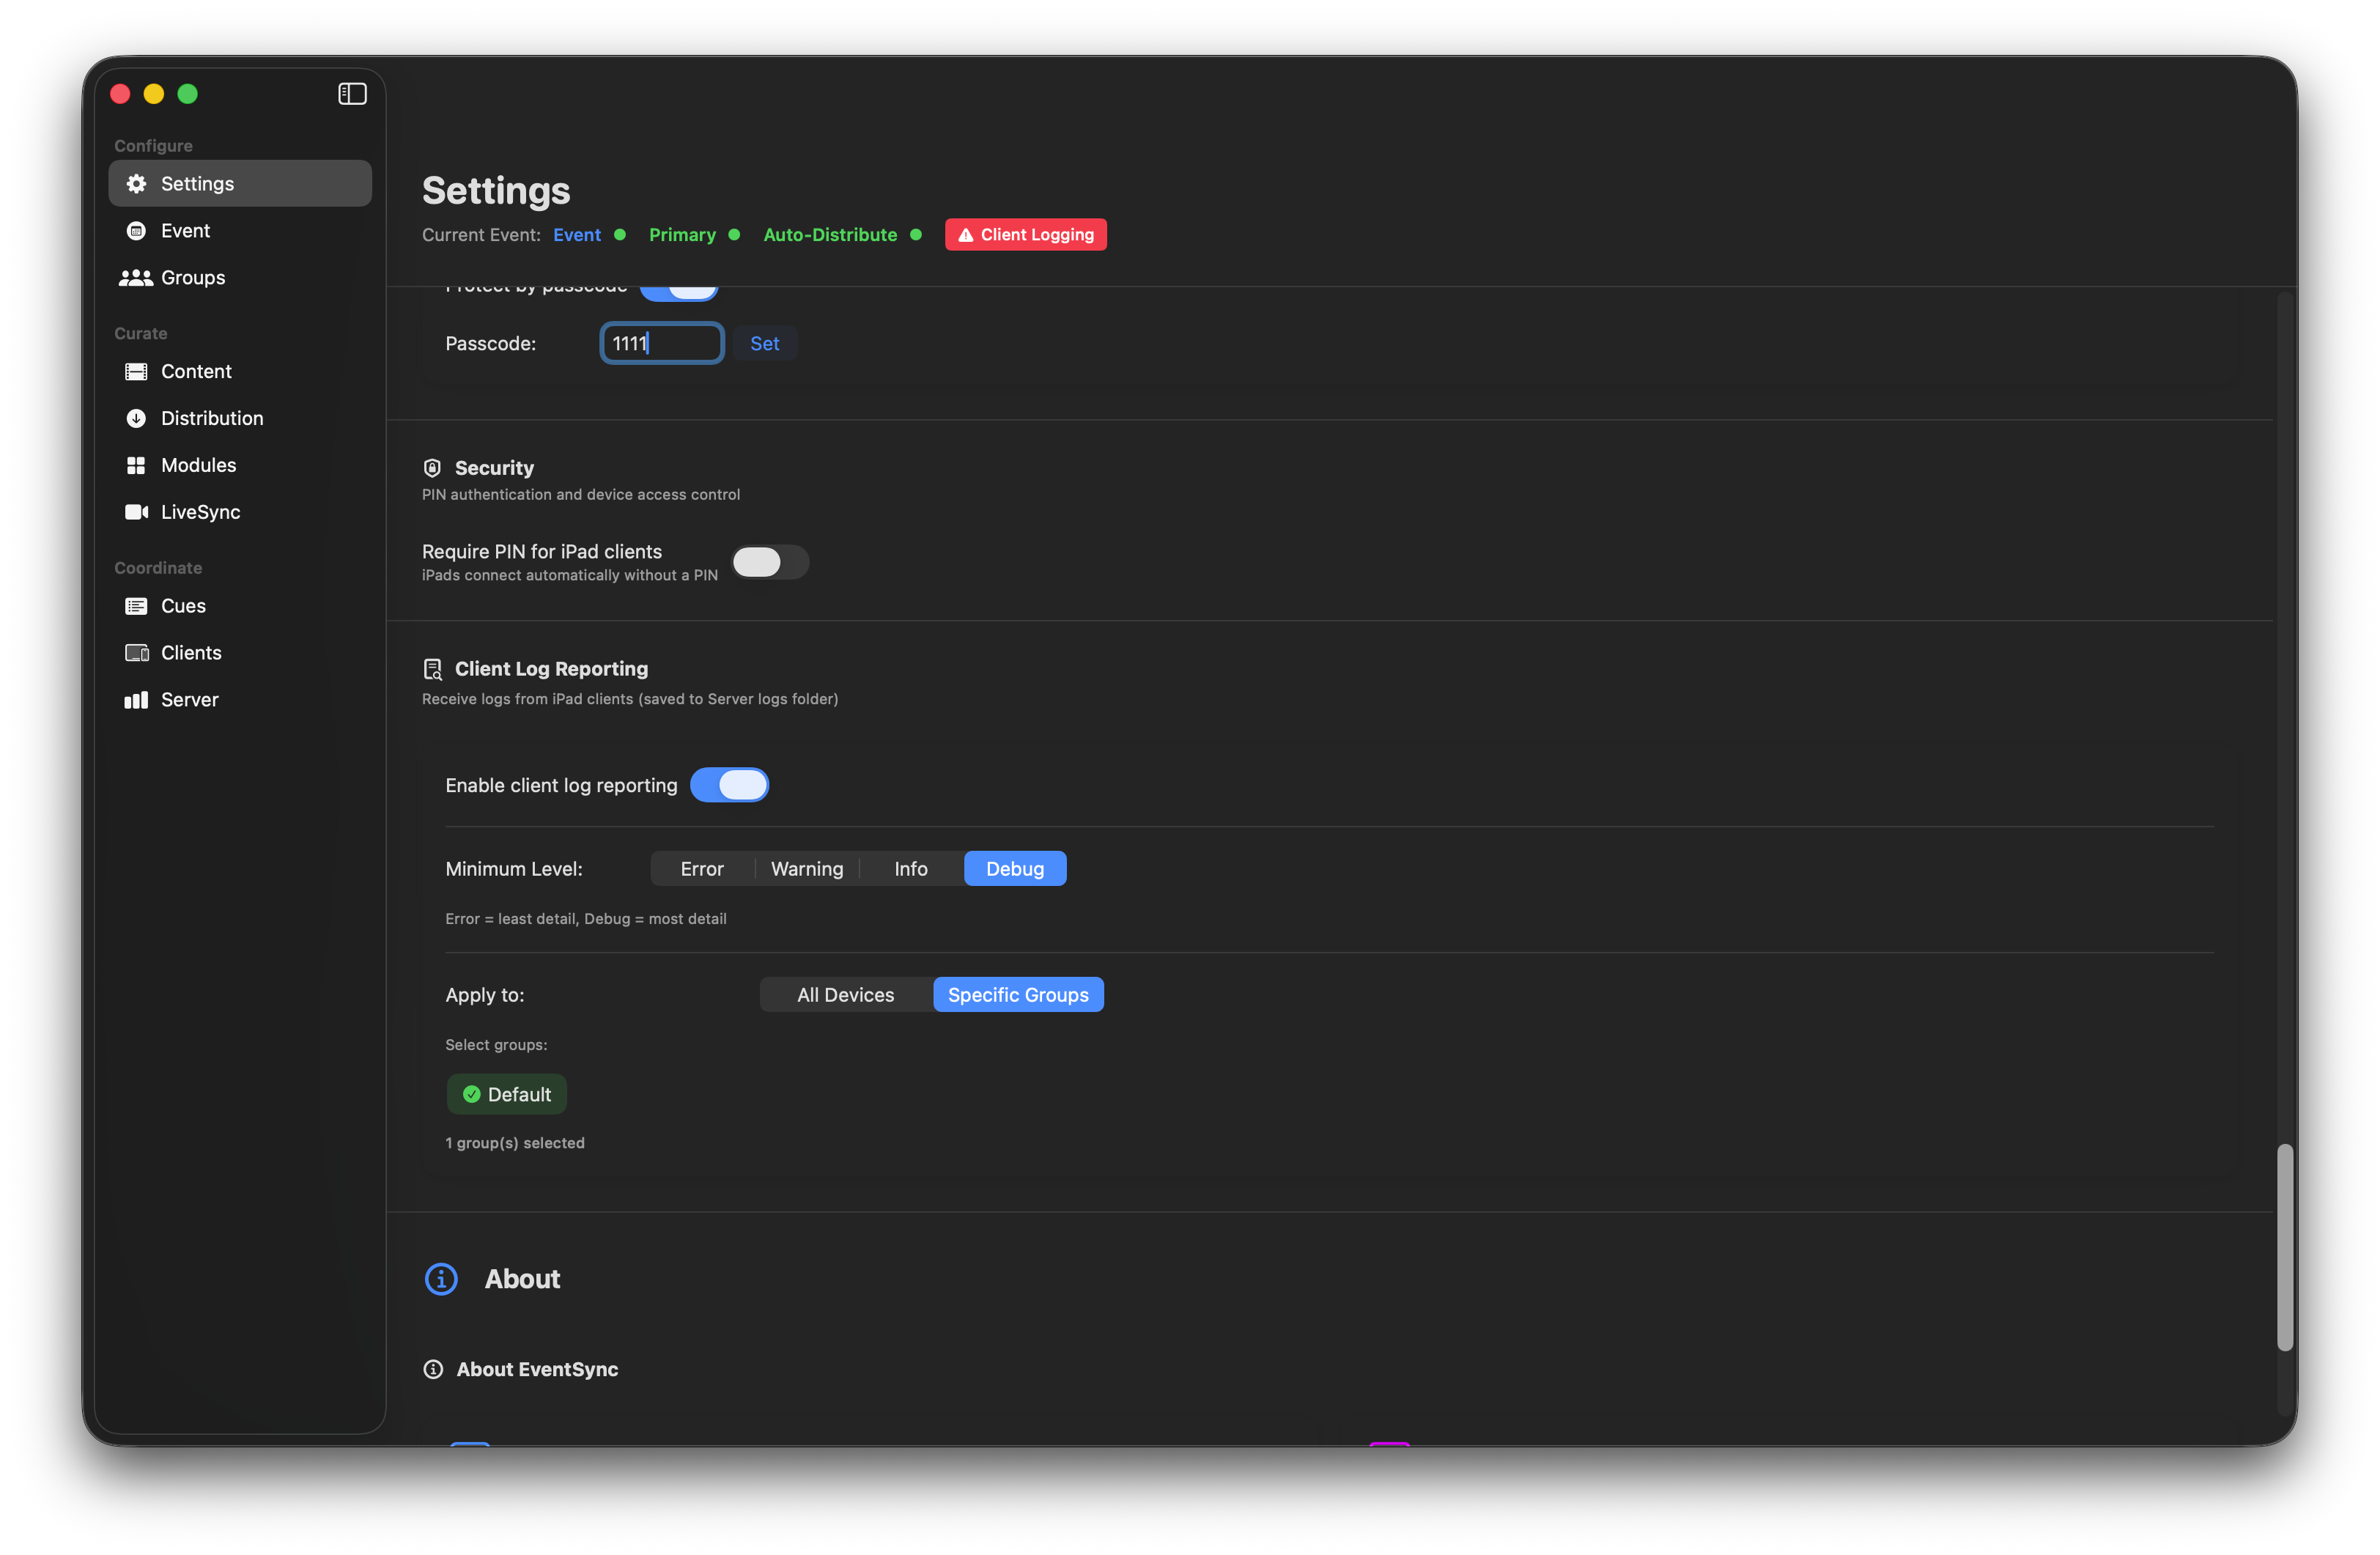
- Minimum Level — Error / Warning / Info / Debug. Error is the highest severity (least output); Debug is the lowest (most output). Use Error or Warning during a show, Info or Debug only when hunting a specific bug.
- Apply to — All Devices or Specific Groups. Use specific groups when you're chasing a problem that only affects one zone.
⚠️ Network impact
Client log reporting adds non-trivial network traffic, especially at Debug level. Enable it while troubleshooting, then turn it off before doors.